| Issue |
A&A
Volume 574, February 2015
|
|
|---|---|---|
| Article Number | A127 | |
| Number of page(s) | 33 | |
| Section | Extragalactic astronomy | |
| DOI | https://doi.org/10.1051/0004-6361/201322805 | |
| Published online | 05 February 2015 | |
Online material
Appendix A: Atomic species
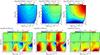 |
Fig. A.1
Fine-structure emission grids with and without Γmech (Z = Z⊙). Top: emission grids. Bottom: relative changes in the emissions as a function of α. The dashed contour traces the R = 1 line, where the emissions with and without extra heating are the same. (See caption of Fig. 4.) |
| Open with DEXTER | |
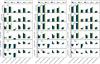 |
Fig. A.2
Line ratios for the reference models as a function of Γmech for the atomic fine structure lines, Z = 0.1, 0.5, and 2 Z⊙ in the left, middle and right panels respectively. |
| Open with DEXTER | |
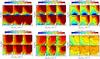 |
Fig. A.3
Atomic line ratio grids as a function of Γmech for AV = 10 mag (Z = Z⊙). |
| Open with DEXTER | |
Appendix B: Molecular species
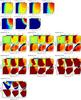 |
Fig. B.1
Top: emission grids of PDR models without mechanical heating for a selection of CO transitions for AV = 10 mag (Z = Z⊙). Bottom: relative changes in the emission as a function of α. The dashed contour traces the R = 1 line, where the emission with and without extra heating are the same. (See caption of Fig. 4.) |
| Open with DEXTER | |
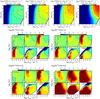 |
Fig. B.2
Top: emission grids of PDR models without mechanical heating for a selection of 13CO transitions for AV = 10 mag (Z = Z⊙). Bottom: relative changes in the emission as a function of α. The dashed contour traces the R = 1 line, where the emission with and without extra heating are the same. (See caption of Fig. 4.) |
| Open with DEXTER | |
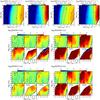 |
Fig. B.3
Top: emission grids of PDR models without mechanical heating for a selection of HCN and HNC transitions for AV = 10 mag (Z = Z⊙). Bottom: relative changes in the emission as a function of α. The dashed contour traces the R = 1 line, where the emission with and without extra heating are the same. (See caption of Fig. 4.) |
| Open with DEXTER | |
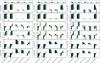 |
Fig. B.4
Various line ratios of HNC and HCN for the reference models (see Table 2) as a function of Γmech for Z = 0.1 Z⊙ (left), 0.5 Z⊙ (middle) and 2.0 Z⊙ (right.) |
| Open with DEXTER | |
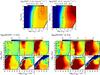 |
Fig. B.5
Top: emission grids of PDR models without mechanical heating for a selection of HCO+ transitions for AV = 10 mag (Z = Z⊙). Bottom: relative changes in the emission as a function of α. The dashed contour traces the R = 1 line, where the emission with and without extra heating are the same. (See caption of Fig. 4.) |
| Open with DEXTER | |
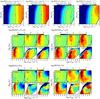 |
Fig. B.6
Top: emission grids of PDR models without mechanical heating for a selection of CN and CS transitions for AV = 10 mag (Z = Z⊙). Bottom: relative changes in the emission as a function of α. The dashed contour traces the R = 1 line, where the emission with and without extra heating are the same. (See caption of Fig. 4.) |
| Open with DEXTER | |
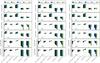 |
Fig. B.7
Various line ratios of HCO+, CS and CN for the reference models (see Table 2) as a function of Γmech for Z = 0.1 Z⊙ (left), 0.5 Z⊙ (middle) and 2.0 Z⊙ (right.) |
| Open with DEXTER | |
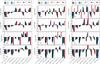 |
Fig. B.8
Various line ratios (at AV = 10 mag) of HCN, HNC, HCO+, CN, and CS which show a strong dependence on Γmech for the reference models (see Table 2) for different metallicities, Z = 0.1 Z⊙ (left), 0.5 Z⊙ (middle) and 2.0 Z⊙ (right.) |
| Open with DEXTER | |
Appendix C: Several model grids
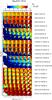 |
Fig. C.1
Grids of CO and 13CO line ratios for different values of α for AV = 10 mag. |
| Open with DEXTER | |
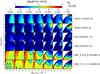 |
Fig. C.2
Grids of various combination of molecular line ratios for different values of α and AV = 10 mag. |
| Open with DEXTER | |
 |
Fig. C.3
Grids of HCN and HNC line ratios for different values of α and AV. |
| Open with DEXTER | |
 |
Fig. C.4
Grids of HNC and HCO+ line ratios for different values of α and AV. |
| Open with DEXTER | |
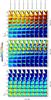 |
Fig. C.5
Grids of HCN and HCO+ line ratios for different values of α and AV. |
| Open with DEXTER | |
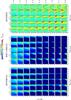 |
Fig. C.6
Grids of HCN, HNC and HCO+ line ratios (J = 1–0 and 8–7) for different cosmic ray ionization rates with AV = 10 mag. |
| Open with DEXTER | |
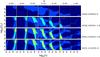 |
Fig. C.7
Constraining the Γmech, AV, n and G0 for starburst galaxies. Illustration for Av = 10 mag. See caption of Fig. 16 for details. |
| Open with DEXTER | |
 |
Fig. C.8
Constraining the Γmech, AV, n and G0 for starburst galaxies. Illustration for Av = 30 mag. See caption of Fig. 16 for details. |
| Open with DEXTER | |
© ESO, 2015
Current usage metrics show cumulative count of Article Views (full-text article views including HTML views, PDF and ePub downloads, according to the available data) and Abstracts Views on Vision4Press platform.
Data correspond to usage on the plateform after 2015. The current usage metrics is available 48-96 hours after online publication and is updated daily on week days.
Initial download of the metrics may take a while.