| Issue |
A&A
Volume 573, January 2015
|
|
|---|---|---|
| Article Number | A82 | |
| Number of page(s) | 34 | |
| Section | Interstellar and circumstellar matter | |
| DOI | https://doi.org/10.1051/0004-6361/201423992 | |
| Published online | 23 December 2014 | |
Online material
Appendix A: Physical parameters of all observed knots
Coordinates and H2 (2.122 μm) fluxes, and physical parameters of the knots detected along the investigated flows.
Appendix B: Individual objects
Appendix B.1: [HSL2000] IRS 1
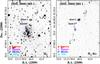 |
Fig. B.1
H2 and continuum-subtracted H2 images (left and right panels) of the [HSL2000] IRS 1 outflow. The positions of the sources, knots, masers, EGOs, and H ii regions are indicated in the figures. |
| Open with DEXTER | |
[HSL2000] IRS 1, coincident with IRAS 12091-6129, was firstly identified by Henning et al. (2000) at MIR wavelengths. The authors also detect a second source, [HSL2000] IRS 2, located ~28″ westwards. G298.2622+00.7391 is the dominant source at 8 μm. Lbol values from the literature range form 1.6 to 5.2 × 10⁴ L⊙ (Walsh et al. 1997; Henning et al. 2000; Lumsden et al. 2013), depending on the adopted distance (3.8–5.8 kpc). According to these estimates, the source spectral type ranges from B0.5 (Henning et al. 2000) to O8.5 (Walsh et al. 1997). Both CH3OH (at 6.67 GHz) and OH maser (at 1.665 GHz) emissions are detected towards the source (Walsh et al. 2001). Although reported in the SIMBAD database, it is not clear whether or not UCH ii emission is associated with this source. Walsh et al. (2001) do not detect any UCH ii region above 1 mJy at 8.64 GHz. Close to the HMYSO, Cyganowski et al. (2008) observed EGO emission (EGO G298.26+0.74), which was interpreted as scattered emission from the continuum (Takami et al. 2012). Indeed, our image (Fig. B.1) does not show any H2 emission at the EGO position. Outflow emission from CO (2–1) and CS (2–1) has been reported (Osterloh et al. 1997; Henning et al. 2000). In our image, the H2 jet is well collimated, but, possibly due to the presence of a multiple system, it shows a large precession angle (~30°). This can be easily inferred by comparing the current PA of the jet emerging from the source (PA ~ 10°) with the PA of the most distant knot (Knot 4, PA ~ − 20°). This explains why the observed CO outflow (Henning et al. 2000) has a very small collimation factor (Rc = 2.53; see Wu et al. 2004). The H2 knots are located within the CO bipolar outflow (see Fig. 1 in Henning et al. 2000), which shows spatially separated red and blue lobes, located SSE and NNW of the source. Knots 1–4 delineate the blue lobe, whereas Knots 5, and 6 are located in the red lobe (see Fig. B.1). Only H2 emission lines are detected in our spectra (Table B.1). Our slit encompasses the source position as well, where just a faint rising continuum emission is detected.
Appendix B.2: IRAS 12405-6219
Originally identified as a planetary nebula candidate from its colours (van de Steene & Pottasch 1993), it has been later recognised as an HMYSO candidate, coincident with an UCH ii region in the RMS catalogue (Lumsden et al. 2013), which reports Lbol = 3.6 × 10⁴ L⊙ at a distance of 4.4 kpc. Location of the object agrees with the position of the NIR source 2MASSJ 12433151-6236135 and that of its MIR counterpart MSX G302.0213+00.2542. NIR and MIR colours indicate that this is a young and embedded object. H2O maser emission near the source position has been reported by Suárez et al. (2009).
Our H2 image (Fig. B.2) shows the presence of several knots: Knots 1–4 are located south of the source, whereas two other knots (A and B) are aligned with the source position towards WSW. We interpret such a geometry as a combination of two distinct flows: the first flow (Knots 1–4) is precessing southwards, with a PA ranging ~170°-184°, whereas the second flow (Knots A and B) is straight with a PA of ~236°. There is no clear detection of the two opposite lobes, likely the red-shifted ones. Our spectra of Knots 1 and 2 show only H2 emission, and that on the source shows a steeply rising continuum with a bright Brγ line in emission (Table B.2).
Appendix B.3: IRAS 13481-6124
Located at a distance of 3.1 kpc (Lumsden et al. 2013), IRAS 13481-6124, spatially coincident with the NIR source 2MASS J13513785-6139075 (see also Fig. 1), was recognised as an HMYSO candidate by Chan et al. (1996), and then confirmed through the SED modelling by Grave & Kumar (2009), who obtained a stellar mass of ~20 M⊙, O9 spectral type and 6 × 10⁴ yr age. VLTI interferometric observations (Kraus et al. 2010) show the presence of a compact dusty disc with a large CO molecular outflow, driven by a parsec-scale H2 jet (Stecklum et al. 2012). Our continuum subtracted H2 image (Fig. 1) shows a precessing jet (precession angle ~8°) extending ~6.9 pc. The current PA of the jet is ~206°. The red lobe is located NE of the source and it is about 1.3 times more extended than the blue lobe. Both lobes display the same number of knots, whose distances from the source are always roughly 1.3 times larger in the red-shifted lobe of the flow, likely indicating that the red-shifted jet is moving in a less dense medium. Two large bow-shocks (A and B) are located at the apex of both lobes, whereas the remaining H2 emanations, from C to G in both lobes, have a knotty and jet-like geometry. As evinced from our analysis, visual extinction increases along the jet towards the source position, from AV = 1 to ~13 mag, whereas both T(H2) and N(H2) (i.e. temperature and column density of the shocked excited H2 gas) decrease (see Table A.1 and Sect. 4.3.1). As pointed out in Sect. 4.3.1, H2 fluorescent emission is confined within few arcseconds from the source (Stecklum et al. 2012) and the H2 emission along the jet is strictly thermalised, suggesting that the circumstellar material around the source screens its FUV emission. Our spectra indicate that H2 emission is present in all knots, whereas [Fe ii] emission is detected only in the red-shifted bow-shocks (see Table B.3).
Apart form those knots belonging to the parsec-scale collimated jet, we detect more H2 knots in our continuum-subtracted H2 image. These may belong to other flows emanating from the source position (i.e. IRAS 13481-6124 might be then a multiple system) or they might come from other YSOs. In particular, among the several H2 emanations, two knots (X and Y, see Fig. 1) are detected above a 3σ threshold and located beyond the extended nebulosity surrounding the source. Knot X, located SSE of the source, has a bow-shock shape, whose orientation might trace back to the source position. Knot Y is located NW of the source and it does not have a definite shape, therefore no definite direction is recognisable. There are no bright YSOs nearby the IRAS source, with the exception of two faint YSO candidates (about 52″ E and 55″ NW of the IRAS position), which are barely detected at 24 μm and at longer wavelengths in the Spitzer/MIPS and Herschel images. Knots X and Y might be then driven by these sources.
Our low resolution spectroscopy on the source (Fig. 1) shows many H i lines from both Paschen and Brackett series. Unfortunately, because the spectral emission in the K band is completely saturated by the source continuum, we cannot detect the Brγ emission on the source, even though it was previously detected through low-resolution spectroscopy (Beck et al. 1991), and at higher spectral and spatial resolution with SINFONI (Stecklum et al. 2012). The spectro-astrometric analysis from these data indicates that the Brγ line is spatially extended with its position angle agreeing with that of the jet. These observations as well as the detection of a collimated parsec-scale jet suggest that the source is still accreting and its disc is not just a passive disc, as proposed by Kraus et al. (2010). IRAS 13481-6124 is among the most evolved and massive objects in our sample, but possesses a powerful and collimated jet. Indeed, given the age estimate of this source (6 × 10⁴ yr; Grave & Kumar 2009), this might seem a real conundrum. In principle, the source should be evolved enough and had already developed an UCH ii region (see e.g. Zinnecker & Yorke 2007; Tan & McKee 2003). However, there are no observations of any UCH ii region around it, and ATCA observations at 3 and 6 cm do not show any radio emission down to 0.48 mJy and 1 mJy, respectively (Urquhart et al. 2007a). Moreover, by analysing the luminosity-to-mass ratio of IRAS 13481-6124 and other HMYSOs, Beltrán et al. (2006) conclude that their HMYSOs are in a pre-ultracompact H ii phase. In conclusion, IRAS 13481-6124 might not be as old as the age estimate suggests.
Observed emission lines in the [HSL2000] IRS 1 jet.
Observed emission lines in one of the two IRAS 12405-6129 jets.
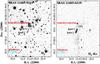 |
Fig. B.2
Same as in Fig. B.1 but for the IRAS 12405-6129 flows. |
| Open with DEXTER | |
|
Fig. B.3
Same as in Fig. B.1 but for the IRAS 13484-6100 flow. |
|
| Open with DEXTER | |
Observed emission lines in the IRAS 13481-6124 jet.
Appendix B.4: IRAS 13484-6100
IRAS 13484-6100 is a compact GLIMPSE source (G310.1437+00.7598) with a cometary-like H ii emission, and it is located at a distance of ~5.5 kpc. CS emission (Bronfman et al. 1996), OH (Caswell 1998), CH3OH (Green et al. 2012) and H2O (Urquhart et al. 2009) masers are detected on the source and in its surroundings. Faúndez et al. (2004) detected the continuum emission from the source at 1.2 mm, and estimated Lbol = 7.1 × 10⁴ L⊙ and Mc = 1.1 × 10³M⊙ from SED analysis. On the other hand, the RMS catalogue (Lumsden et al. 2013) provides two different Lbol values of ~5 × 10³ L⊙ and 4.3 × 10⁴ L⊙ for the HMYSO and the H ii region, respectively. A bipolar EGO emission (EGO G310.15+0.76) is detected by Cyganowski et al. (2008), located ~16″ NE of the source position.
Figure B.3 shows our H2 and continuum-subtracted H2 images of IRAS 13484-6100, and Table B.4 lists the emission lines detected in the spectra. In our continuum-subtracted H2 image (Fig. B.3) the EGO emission partially overlaps with Knot 1, located at a PA of ~53° with respect to the source. A second knot (Knot 2) is observed ~4″ SW of Knot 1. From our images it is not clear whether or not these emissions belong to the same flow. Radio continuum emission at 6 cm is detected towards the Knot 1 position (Urquhart et al. 2007a). Apart from H2 emission, our spectra reveal strong [Fe ii] lines in both knots as well as towards the source position, which shows a faint raising continuum. Brγ emission from a dissociative shock (see Sect. 5.1) is also detected in Knot 1 (see Table B.4).
Observed emission lines in the IRAS 13484-6100 jet.
Appendix B.5: IRAS 14212-6131
Spitzer GLIMPSE images reveal the presence of three IR sources in this region (see Fig. 2 and discussion in Sect. 4.1). The most embedded source (G313.7654-00.8620; α(J2000) = 14:25:01.53, δ(J2000) = −61:44:57.7) is not detected in the NIR and its position agrees with that of the millimetric continuum emission observed by Faúndez et al. (2004). The IRAS position is displaced ~15″ westwards of the G313.7654-00.8620 position. The other two sources are visible at NIR wavelengths (2MASSJ 14245631-6144472 and 2MASSJ 14245547-6145227) and they are positioned ~38″ WNW and ~40″ SW of the main source, respectively. The location of the OH maser emission detected by Caswell (1998) agrees with that of G313.7654-00.8620. Assuming a distance of 4 kpc, Faúndez et al. (2004) derive a bolometric luminosity of Lbol = 1.2 × 10⁵ L⊙ and core mass (Mc) of Mc = 1.1 × 10³M⊙ from SED analysis. Lumsden et al. (2013) assume a distance of 7.8 kpc and obtain Lbol = 1.7 × 10⁴ L⊙. G313.7654-00.8620 drives the main flow of the region. CS (Bronfman et al. 1996) and CO (Urquhart et al. 2007b) emissions have been detected close to the source. H2 emission was first observed by De Buizer (2003). Four CH3OH maser spots are aligned along the flow (Walsh et al. 1997). EGO emission (EGO G313.76-0.86; Cyganowski et al. 2008) lies westwards of the source. Our continuum-subtracted H2 image (Fig. 2, right) shows four knots (1–4; suggesting an outflow with a precession angle of ~32°) driven by the central source G313.7654-00.8620. These knots are located westwards of the source, depicting the blue-shifted lobe as our ISAAC/VLT high resolution spectra indicate (Caratti o Garatti et al., in prep.). From the position of Knot 1 we infer that the current PA of the jet is ~305°. A faint H2 emission, with S/N below 3σ, appears eastwards of the source, likely depicting the red-shifted jet. As for other sources in our sample, the high visual extinction possibly prevents us from properly detecting one of the two lobes. A fifth knot (Knot 5) is detected SW from the source and it does not belong to the main flow; it is likely to be associated with a different YSO (2MASSJ14245547-6145227). The lines detected in our spectra are reported in Table B.5.
Observed emission lines in the IRAS 14212-6131 jet.
Appendix B.6: SSTGLMC G316.7627-00.0115
Positioned in the IRAS 14416-5937-B region (d = 2.8 kpc), SSTGLMC G316.7627-00.0115 was first recognised as a massive YSO candidate by Nyman et al. (2001) and Vig et al. (2007). It is located at the south-eastern end of the filamentary IRDC G316.72+0.07. This IRDC is rather pristine and just contains a few weaker MIR and FIR embedded sources (Ragan et al. 2012). The IRDC itself attains a high MIR extinction contrast (i.e. high column densities) and contains masses up to 900 M⊙ (Linz et al. 2007). SSTGLMC G316.7627-00.0115 does not seem to have a NIR counterpart, although it is quite close (~2″) to 2MASSJ 14245547-6145227, which was recognised as the NIR counterpart (Vig et al. 2007). Two OH maser emissions have been detected close to the source position (Caswell 1998). Eastwards and westwards of the source position, we detect two aligned H2 knots (1 and 2) (see Fig. B.4), whose PA is ~275![]() 5 or ~95
5 or ~95![]() 5, depending on Knot 2 association with the blue- or red-shifted lobe, respectively. Only H2 emission lines are detected in the spectra of the two knots (see Table B.6). Our continuum-subtracted H2 image also shows the presence of a second flow ~35″ NE of the source, likely driven by a low-mass YSO. The photometric data used for our SED analysis are reported in Table B.7. Our SED analysis of SSTGLMC G316.7627-00.0115, shown in Fig. B.5, provides us with a bolometric luminosity of 5 × 10³ L⊙, at a distance of 2.8 kpc (Urquhart et al. 2013).
5, depending on Knot 2 association with the blue- or red-shifted lobe, respectively. Only H2 emission lines are detected in the spectra of the two knots (see Table B.6). Our continuum-subtracted H2 image also shows the presence of a second flow ~35″ NE of the source, likely driven by a low-mass YSO. The photometric data used for our SED analysis are reported in Table B.7. Our SED analysis of SSTGLMC G316.7627-00.0115, shown in Fig. B.5, provides us with a bolometric luminosity of 5 × 10³ L⊙, at a distance of 2.8 kpc (Urquhart et al. 2013).
|
Fig. B.4
Same as in Fig. B.1 but for the SSTGLMC G316.7627-00.0115 flow. |
|
| Open with DEXTER | |
Appendix B.7: Caswell OH 322.158+00.636
The location of Caswell OH 322.158+00.636 agrees with that of the MIR source MSX G322.1587+00.6256; no NIR counterpart is detected in the 2MASS catalogue. The object is located in a very complex region, dominated at NIR wavelengths by a large nebulosity, possibly illuminated by two bright massive stars (Moisés et al. 2011). OH and CH3OH masers are detected towards the source position (Caswell 1998; Urquhart et al. 2013). In the Spitzer GLIMPSE images the source is saturated at both 24 μm and 70 μm, whereas its emission is below the linearity limit in the Herschel PACS images. A second fainter IR object, MSX5C G322.1587+00.6262, is positioned about 35″ SE of the source. In our continuum-subtracted H2 image (see Fig. B.6) we detect a bright knot (Knot 1) ~5″ SW of the source, almost coincident with a very bright EGO observed in the Spitzer/IRAC images. Our NIR spectroscopy shows both H2 and [Fe ii] emission from this knot (Table B.8). The knot position angle is ~210°. Our continuum-subtracted H2 image also shows the presence of a second bright knot, Knot 2, positioned about 68″ SE of the Knot 1. Knot 2 does not seem to emanate from MSX G322.1587+00.6256, but more likely from MSX5C G322.1587+00.6262. The retrieved photometry of MSX G322.1587+00.6256 is reported in Table B.9. By assuming a distance of 4.3 kpc (Urquhart et al. 2013), our SED analysis (see Fig. 4) provides us with an Lbol of ~1.3 × 10⁵ L⊙, roughly corresponding to an O7 ZAMS star with a mass of ~30 M⊙. Therefore this object is the most luminous and massive of our sample.
Appendix B.8: IRAS 15394-5358
IRAS 15394-5358 is part of a small cluster of YSOs, where CO (Urquhart et al. 2007b) and CS (Bronfman et al. 1996) emissions as well as CH3OH (Caswell 1998) and H2O (Scalise et al. 1989) masers are observed. Faúndez et al. (2004) detected continuum emission at 1.2 mm. By assuming a distance of 2.8 kpc, they obtained Lbol = 1.5 × 10⁴ L⊙ and Mc = 8 × 10³M⊙ from the SED analysis. On the other hand, Lumsden et al. (2013) reported a distance of 1.8 kpc and derived Lbol = 4 × 10³ L⊙.
Observed emission lines in the SSTGLMC G316.7627-00.0115 jet.
SSTGLMC G316.7627-00.0115 available photometry.
Our continuum-subtracted H2 image (Fig. B.7) shows two bright jets emanating from IRAS 15394-5358, that is surrounded by an extended nebulosity. There is a relatively bright NIR source at the centre of the nebula (2MASSJ 15431897-5407356), and an H ii region is located 15″ eastwards (Bronfman et al. 1996). In the K band image, we detect a very faint source (α = 15:43:18.945, δ = −54:07:37.84, J2000, not detected in 2MASS) ~2″ southwards of 2MASSJ 15431897-5407356. This might be the second component of the binary system that drives the two flows. The system is not resolved in the Spitzer GLIMPSE images, and we do not have any other photometric or colour information to prove the nature of this source. The first precessing jet (precession angle ~42°) is composed of Knots 2, 3, 6, 7, 8, 9 (the blue-shifted lobe; Caratti o Garatti et al. in prep.) and Knots 1 and, possibly, 10 and 11 (likely to be the red-shifted lobe). It has a C shape and it is likely driven by the brightest NIR source (2MASSJ 15431897-5407356). The PA of the jet is ~207°. The second flow is likely driven by the faintest NIR companion and shows two knots (4 and 5), roughly aligned with the faint NIR source. Its PA is ~300°, if Knot 4 is part of the blue-shifted lobe (because of its lowest visual extinction), or it is ~120°, if Knot 4 belongs to the red-shifted lobe. Our spectral analysis indicates the presence of both H2 and [Fe ii] emission along the first flow, whereas only H2 emission is detected along the second flow (see Table B.10). Finally, in our continuum-subtracted H2 image (Fig. B.7), a third H2 flow is detected. This flow is likely driven by another HMYSO, namely G326.474+0.697 (Garay et al. 2007b), which is detected at FIR wavelengths in both Spitzer and Herschel images. The flow displays several knots extending NE-SW of the source position. EGO G326.48+0.70 (Cyganowski et al. 2008) is associated with this third outflow. The flow was not encompassed by our slits and it is not discussed further in this paper.
Observed emission lines in the Caswell OH 322.158+00.636 jet.
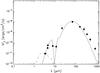 |
Fig. B.5
Spectral energy distribution (SED) of SSTGLMC G316.7627-00.0115 constructed with all photometric data available from the literature, namely from 3.6 μm to 870 μm, and assuming a distance of 2.8 kpc to the source (Ragan et al. 2012). |
| Open with DEXTER | |
Appendix B.9: IRAS 15450-5431
The location of IRAS 15450-5431 agrees with that of a bright GLIMPSE source (G326.7807-00.2409) in the MIR and with that of 2MASSJ 15485523-5440375 in the NIR. CS (Bronfman et al. 1996) and H2O maser emission (Urquhart et al. 2009) are reported close to the source location. The RMS catalogue provides a distance of 3.9 kpc and a bolometric luminosity of 9 × 10³ L⊙. EGO G326.78-0.24 (Cyganowski et al. 2008) is located close to the IR source. Our K band and H2 images (see the H2 image in Fig. B.8, left) show a cone-like nebulosity NE of the NIR source, likely depicting an outflow cavity. A precessing jet (precession angle ~33°) emerging from this outflow cavity is detected in the continuum-subtracted H2 image (Fig. B.8, right). From the position of Knot 4 we derive a jet PA of ~31°, and only one lobe, likely the blue-shifted one, is detected. Only H2 emission lines are detected along the flow in our spectra (see Table B.11). The on-source spectrum shows a bright rising continuum with puzzling H i lines from the Brackett series in absorption. Indeed there are examples in the literature where photospheric lines could be detected from the scattered light (e.g. Cohen et al. 1986; Neckel & Staude 1995).
Caswell OH 322.158+00.636 available photometry.
Appendix B.10: IRAS 16122-5047
IRAS 16122-5047 is not well studied. According to the Spitzer GLIMPSE images, IRAS 16122-5047 seems to be part of a small cluster, composed of two sources, well detected at 24 μm, and a few more fainter objects. The location of the brightest IR source in our field (GLIMPSE G332.3526-00.1154), the only one detected at 70 μm with MIPS, agrees with that of 2MASSJ 16160689-5054274. OH maser emission is detected on source (Caswell 1998) and CH3OH maser emission is detected towards EGO G332.35-0.12 (Chen et al. 2011). Two EGOs are reported by Cyganowski et al. (2008), namely EGO G332.35-0.12 close to the NIR source, and EGO G332.33-0.12, about 74″ SW of the 2MASS source. Both K band and H2 images (see H2 image in Fig. B.9, left) show some nebulosity around the 2MASS source, that might delineate an outflow cavity (towards NNE), although the geometry does not appear so clear in our images. The continuum-subtracted H2 image shows two different flows, which appear to emanate from the 2MASSJ 16160689-5054274 position. The first flow, which includes Knots A, B, C, and D, has a curved shape. Its PA, measured from Knot A position, is ~15°. The second flow includes Knots 1, 2, 3, and it has a straight geometry with a PA of ~14°. There is an additional knot (R1), which is located in the opposite direction of both flows. Therefore it is not clear as to which flow it belongs. It is likely to be part of the red-shifted lobe of one of the two flows. Only H2 lines are detected in the spectra of the knots (see Table B.12). Collected photometry is reported in Table B.13. Assuming a distance of 3.1 kpc (Urquhart et al. 2013), our SED analysis provides a bolometric luminosity of ~5 × 10³ L⊙ (see Fig. B.10).
Observed emission lines in the IRAS 15394-5358 jets.
Observed emission lines in the IRAS 15450-5431 jet.
|
Fig. B.6
Same as in Fig. B.1 but for the Caswell OH 322.158+00.636 flow. |
|
| Open with DEXTER | |
|
Fig. B.7
Same as in Fig. B.1 but for the IRAS15394-5358 flows. |
|
| Open with DEXTER | |
|
Fig. B.8
Same as in Fig. B.1 but for the IRAS 15450-5431 flow. |
|
| Open with DEXTER | |
|
Fig. B.9
Same as in Fig. B.1 but for the IRAS 16122-5047 flows. |
|
| Open with DEXTER | |
Observed emission lines in the IRAS 16122-5047 jets.
Appendix B.11: IRAS 16547-4247
IRAS 16547-4247 or G343.126-0.062 is an isolated massive and dense core located at a distance of 2.9 kpc (Garay et al. 2003; Rodríguez et al. 2008). Its bolometric luminosity estimates range from 6.2 × 10⁴ L⊙ (Garay et al. 2003; Faúndez et al. 2004) to 6.6 × 10⁴ L⊙ (Lumsden et al. 2013, who assume a distance of 2.8 kpc to the source). These values are consistent with an O9 spectral type for a single ZAMS star. The core mass derived from the dust emission at 1.2 mm is 1.4 × 10³M⊙ (Faúndez et al. 2004). The source is not detected in our NIR images or in the Spitzer/IRAC images, although it is visible as a single object in the Spitzer/MIPS images at 24 μm. At high spatial resolution, Submillimeter Array (SMA) observations of the dust continuum at 1.3 mm (Franco-Hernández et al. 2009) trace a more complex structure, indicating that there might be at least two objects. H2O masers were detected towards the source position (Batchelor et al. 1980). SMA observations at a higher spatial resolution show that water maser emission is present in several distinct parts of the region (Franco-Hernández et al. 2009). In particular, a compact structure located at the disc position and perpendicular to the radio jet shows a velocity gradient possibly arising from Keplerian motion, which would imply a mass of ~30 M⊙ for the central star(s). The source drives a thermal radio jet, extending 0.14 pc with a PA of ~163° (Garay et al. 2003; Rodríguez et al. 2005). A parsec-scale H2 flow (MHO 1900–1902) well aligned with the radio jet was observed by Brooks et al. (2003). More recently, Garay et al. (2007b) observed a well collimated CO bipolar outflow roughly oriented in the north-south direction (the blue-shifted lobe lies southwards; see e.g. Garay et al. 2007a), close to the plane of the sky (i = 84°±2°). EGO emission (EGO G343.12-0.06) has been also detected close to the source (Cyganowski et al. 2008). As for the majority of the EGOs, such emission can be due to scattered continuum in the HMYSO outflow cavities (Takami et al. 2012).
Figure B.11 shows the H2 and continuum-subtracted H2 images from ISAAC. These data were originally presented by Brooks et al. (2003). We reduced and analysed the data again, finding similar results (e.g. calibrated fluxes are identical, within the errors). We also keep the knot nomenclature same as in Brooks et al. (2003). In addition, we detect another knot (named A6), which is also visible in their Fig. 1. This is likely the terminal bow-shock of the red-shifted lobe. Because of to the high visual extinction, no H2 emission is detected near the source position, therefore the current jet PA is not measurable. We assume a PA of 177° pm 4°, according to the observed radio jet emission (Franco-Hernández et al. 2009). The extension of the whole jet, including both lobes, is about 3.4 pc at a distance of 2.9 kpc. The jet shows one of the largest precession angle in our sample, i.e. 57° (computed from Knots B1 and B2), and the jet axis PA drifts from ~161° to 218°. Our sepectroscopic analysis reveals both H2 and [Fe ii] emission lines in the analysed knots (see Table B.14).
IRAS 16122-5047 available photometry.
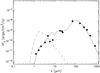 |
Fig. B.10
Spectral energy distribution (SED) of IRAS 16122-5047 constructed with all photometric data available from the literature, namely from 3.6 μm to 870 μm, and assuming a distance of 3.1 kpc (Urquhart et al. 2013). |
| Open with DEXTER | |
Observed emission lines in the IRAS 16547-4247 jet.
Observed emission lines in the BGPS G014.849-00.992 jet.
Appendix B.12: BGPS G014.849-00.992
BGPS G014.849-00.992 (α = 18:21:12.922, δ = −16:30:10.2, J2000) was first reported in the Bolocam Galactic Plane Survey (BGPS) catalogue (Rosolowsky et al. 2010). A second source (G014.8516-00.9890), located ~12″ NW of BGPS G014.849-00.992, is also detected in the Spitzer GLIMPSE images at 24 μm (see Fig B.12). This source is not spatially resolved in the Spitzer/MIPS images at 70 μm. In Herschel PACS images at 70 μm, the two sources are partially resolved, and BGPS G014.849-00.992 is the brightest source at 70 μm whereas the second source is barely detected, indicating that BGPS G014.849-00.992 is the dominant source at FIR wavelengths. Lim et al. (2012) report the detection of strong multiple H2O maser emissions along the flow as well as CH3OH maser emission close to the location of the BGPS source (~10″). None of the sources is detected in our NIR images. Two flows are likely detected in our continuum-subtracted H2 image (Fig. B.12, right). The first flow is driven by BGPS G014.849-00.992, located close to Knot 1, and it is composed of Knots 1, 2 and, possibly, 7. Its PA is ~324° or ~144°, depending on whether or not Knot 2 belongs to the blue-shifted lobe. There is a second curved flow, composed of Knots 4, 5, 6, and, possibly, 7. It is slightly misaligned with respect to the second IR source, therefore the latter might not be the driving source. It is worth noting, however, that no additional IR sources are detected in the FoV. Our NIR spectra show only H2 emission along the flows (see Table B.15). Collected photometry is reported in Table B.16. Figure B.13 shows the SED analysis of BGPS G014.849-00.992. By assuming a distance of 2.5 kpc (Csengeri et al. in prep.), best fitting model indicates an Lbol value of 1.3 × 10³ L⊙ and a central mass of ~8 M⊙, namely at the edge of the HMYSO regime.
Appendix B.13: GLIMPSE G035.0393-00.4735
GLIMPSE G035.0393-00.4735 is an IR source, observed from MIR wavelengths longward. It belongs to the IR dark cloud SDC G35.041-0.471 (Peretto & Fuller 2009). EGO emission (EGO G035.04-0.47) was detected close to the source position (Cyganowski et al. 2008). Lee et al. (2012) detect H2 emission associated with the IR source, named MHO 2429. The H2 emission is precessing and shows two lobes (see their Fig. 14), a bright one (MHO 2429 A), possibly the blue-shifted one, and a faint one (MHO 2429 B), possibly the red-shifted one. In our continuum-subtracted H2 image (Fig. B.14, right), we detect two bright Knots (1 and 2) in the lobe coincident with MHO 2429 A, and a third knot, with S/N< 3, at the location of MHO 2429 B. As for other sources in our sample, the jet emission from one of the two flow lobes is likely hampered by the high visual extinction. The jet PA is ~205° or ~25°, depending on whether or not Knot 2 belongs to the blue- or red-shifted lobe, and it has a precession angle of 22°. The spectra of the observed knots show only H2 emission (see Table B.17). Collected photometry is reported in Table B.18. By assuming a distance of 3.4 kpc, our SED analysis in Fig. B.15 provides us with an Lbol value of 2–4 × 10² L⊙ and a central mass of ~5 M⊙, suggesting that GLIMPSE G035.0393-00.4735 is an intermediate-mass YSO and not an HMYSO.
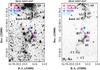 |
Fig. B.11
Same as in Fig. B.1 but for the IRAS 16547-4247 flow. |
| Open with DEXTER | |
|
Fig. B.12
Same as in Fig. B.1 but for the BGPS G014.849-00.992 flow. |
|
| Open with DEXTER | |
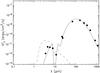 |
Fig. B.13
Spectral energy distribution (SED) of BGPS G014.849-00.992 constructed with all photometric data available from the literature, namely from 3.6 μm to 1.1 mm, and assuming a distance of 2.5 kpc to the source (Lim et al. 2012). |
| Open with DEXTER | |
BGPS G014.849-00.992 available photometry.
Appendix B.14: G35.2N
G35.20-0.74 N (G35.2N), also known as IRAS 18556+0136, is a massive star forming region at a distance of 2.2 kpc (Zhang et al. 2009). Radio continuum emission shows a collimated jet directed northwards (Heaton & Little 1988; Gibb et al. 2003). Coincident with the radio jet emission a collimated jet has been detected at NIR and MIR wavelengths (Fuller et al. 2001; De Buizer 2006; Zhang et al. 2013). An SW-NE poorly collimated CO outflow (collimation factor of 2.4–2.6, see Beuther et al. 2002; Wu et al. 2004) was first detected by Dent et al. (1985), with the blue-shifted lobe located NE of the IRAS position. Additional CO and SiO observations at higher angular resolution (Gibb et al. 2003; Birks et al. 2006) suggested the presence of multiple precessing outflows. Both papers consider this interpretation more plausible than the jet precession to explain the different jet/outflow orientations. On the other hand, Lee et al. (2012) detect an hourglass-shape H2 emission with a large opening angle of ~40° (MHO 2431) emanating from the central region and extending ~2′ SW-NE, i.e. ~1.3 pc at a distance of 2.2 kpc. They interpret this as a single outflow with a large opening angle, rather than as two distinct jets.
Indeed, it is not clear if there is just a single massive source at the centre of the region (Zhang et al. 2013) or rather a small cluster (Sánchez-Monge et al. 2013). A 0.2 pc interstellar disc-like structure was detected in H13CO+, H13CN and millimetre continuum emission (Dent et al. 1985; Gibb et al. 2003; Sánchez-Monge et al. 2013). At least three separate cores, namely G35.2N (A and B) and [GHL2003] G35MM2 (hereafter G35MM2), are clearly detected with ALMA high angular observations (see Fig. 2 in Sánchez-Monge et al. 2013). Sánchez-Monge et al. (2013) estimate a mass of ~18 M⊙ for the A/B G35.2N clumps.
Estimates of the observed bolometric luminosity are between 3.1×10⁴ and 3.3 × 10⁴ L⊙ (Lumsden et al. 2013; Zhang et al. 2013). However, Zhang et al. (2013) provide a more complex SED modelling, which takes into account both the foreground extinction and the so called flash-light effect, i.e. the loss of photons through the outflow cavities. Their Lbol estimate ranges between 7 × 10⁴ and 2.2 × 10⁵ L⊙, consistent with a single star of 20–30 M⊙. Such values, however, are in contrast with the momentum flux measured from the CO outflow, that is more than one order of magnitude smaller than expected from such a luminous object (Zhang et al. 2013). Sánchez-Monge et al. (2013) argue that a binary system with a total mass of 18 M⊙ would better fit the measured bolometric luminosities and outflow momentum flux, as well as it would better explain the jet/outflow axes displacement.
Our images indicate the presence of two main precessing jets (see Fig. 3). The first precessing jet (Knots 1–5) is launched by G35.2N, most likely from the position of clump B. Our NIR continuum images show a conical emission (PA~9°, opening angle of ~45°), which is most likely the CO outflow cavity of the blue-shifted lobe of flow I (Gibb et al. 2003; Birks et al. 2006, see also Fig. 3 and discussion in Sect. 4.1), excavated by the jet. The current jet position angle (close to the source position, YSO emission + Knot 2) is ~− 1°, i.e. coincident with the MIR and radio jet emission. The jet is then bending and precessing towards NE (Knots 3–5) with a precession angle of ~28°, in agreement with the opening of the outflow cavity. Knot 1 and the emission towards SSW seem to depict the red-shifted lobe of the jet. According to our spectroscopic analysis, the H2 knots are clearly tracing the jet axis, and not oblique shocks from an expanding shell/outflow as suggested by Lee et al. (2012), because of their excitation conditions. Most important, [Fe ii] emission is clearly detected along the whole blue-shifted part of this flow, namely in the jet inside the outflow cavity and in Knots 2–5. Such emission is produced by strong dissociative shocks and it always traces the axis of the jets (Nisini et al. 2002; Pyo et al. 2006; Shang et al. 2006; Caratti o Garatti et al. 2009), therefore it cannot be associated with any outflow cavity or expanding flow (see Table B.19). As in other flows, this jet is highly asymmetric, namely one lobe is more extended than the other (in this case the blue-shifted lobe is ~2.5 times more extended than the red one).
The second flow is composed of Knots 6 and 7, in the red-shifted lobe, and Knots 8–10, in the blue-shifted lobe. This flow has a precession angle of 26°, and, if we consider the two terminal shocks of the flow (Knot 6 and 10), the flow position angle is ~45°. We do not detect emission from any outflow cavity in our images, nor any source emission in the Spitzer GLIMPSE images, indicating that the driving source must be very embedded and young. G35.2N is not a feasible candidate because the opening angle of the outflow cavity does not match with the jet position. On the other hand, G35MM2 position lies very close (~0.̋7) to the line intersecting the two terminal shocks, therefore it is the best driving source candidate. However, given the large precession angle of the jet and the lack of H2 emission close to the launching region, we cannot exclude other embedded sources as possible candidates.
Observed emission lines in the GLIMPSE G035.0393-00.4735 jet.
GLIMPSE G035.0393-00.4735 available photometry.
 |
Fig. B.14
Same as in Fig. B.1 but for the GLIMPSE G035.0393-00.4735 flow. |
| Open with DEXTER | |
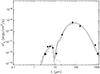 |
Fig. B.15
Spectral energy distribution (SED) of GLIMPSE G035.0393-00.4735 constructed with all photometric data available from the literature, namely from 3.6 μm to 1.1 mm, and assuming a distance of 2.5 kpc to the source (Lim et al. 2012). |
| Open with DEXTER | |
Observed emission lines in the G35.2N jets.
© ESO, 2014
Current usage metrics show cumulative count of Article Views (full-text article views including HTML views, PDF and ePub downloads, according to the available data) and Abstracts Views on Vision4Press platform.
Data correspond to usage on the plateform after 2015. The current usage metrics is available 48-96 hours after online publication and is updated daily on week days.
Initial download of the metrics may take a while.