| Issue |
A&A
Volume 572, December 2014
|
|
|---|---|---|
| Article Number | A118 | |
| Number of page(s) | 34 | |
| Section | Planets and planetary systems | |
| DOI | https://doi.org/10.1051/0004-6361/201423702 | |
| Published online | 08 December 2014 | |
Online material
Appendix A: Planetesimal mass deposition: impact geometry
|
Fig. A.1
Left panel: trajectories of 100 km icy planetesimals in the envelope of the protoplanet in the Σ10 case at crossover for two different impact parameters. The critical case (red) and the mean case (blue) are shown. The three concentric black circles are the Hill sphere, capture, and core radius (from large to small). Right panel: zoom-in onto the central regions of the two trajectories. The color code gives the instantaneous mass loss rate along the trajectory. Almost all of the mass is deposited in the terminal explosion (red parts of the trajectory). The black circles are again the capture and core radius. |
|
| Open with DEXTER | |
The radial mass deposition profiles due to impacting planetesimals shown in Fig. 1 were calculated for an exact head-on impact geometry. However, it is clear that off-center impacts are much more likely than the (near) head-on case because of the larger collisional cross section. In this Appendix we investigate the consequences of non-central impact geometries on the mass deposition profile.
The dissipative effect of gas drag increases the collisional cross section of a protoplanet that has a gaseous envelope beyond the cross section that is caused by gravitational focussing only (Podolak et al. 1988; Inaba & Ikoma 2003). The largest impact parameter that leads to accretion is defined as the critical impact parameter pcrit. It results in a planetesimal trajectory with an apocenter after the first encounter that is equal to the protoplanet’s Hill sphere radius (Pollack et al. 1996). Such an orbit must inevitably lead to the accretion of the planetesimal (at least in the two-body approximation of protoplanet and planetesimal that is used here) while planetesimals with a larger impact parameter leave again the planet’s Hill sphere and return under the dominant gravitational control of the star. Assuming that planetesimals enter the protoplanet’s Hill sphere isotropically then leads to a mean impact parameter of pmean = pcrit/![]() .
.
Figure A.1, left panel, shows the trajectories of 100 km planetesimals in the envelope of the protoplanet in the Σ10 simulation at the crossover point when the core and envelope mass is approximately 16 M⊕. The core radius (about 0.27 R♃), the capture radius (the pericenter of the critical orbit on the first encounter, about 6.9 R♃), and the Hill sphere radius (about 348 R♃) are also shown.
In the critical case, the planetesimal is destroyed after about 17 orbits around the protoplanet. In the mean case, the planetesimal is destroyed already during the first encounter. This indicates that the annulus of impact parameters that lead to spiraling trajectories is only relatively narrow. The right panel of the figure shows a zoom-in onto the central regions of the two trajectories. The color of the lines shows the instantaneous mass loss rate.
One sees that the mass loss rate is on the order of 1016 g/s during the first few pericenter passages. However, as soon as the aerodynamical disruption starts (at the very end of the trajectories), the mass loss rate increases very rapidly by approximately four orders of magnitudes. This is caused by the rapid increase in the planetesimals’s cross section as the planetesimal is deformed by the aerodynamic load into a flat “pancake”, leading to a terminal explosion (Zahnle 1992; Chyba et al. 1993). This final destruction phase where more than 90% of the mass is deposited has a duration of only ~100 s. It is a violent process where an energy deposition rate of ~1031 erg/s is reached.
Figure A.2 shows the corresponding radial mass deposition profiles. The curve for the head-on case is the same as shown in Fig. 1. All three curves share the property that the mass loss rate is relatively small in the outer layers where only thermal ablation occurs, followed by a sharp upturn when the aerodynamic disruption starts. The details differ, however, and can be understood from the shape of the trajectories. One first notes that the aerodynamical disruption begins in the head-on and mean cases at approximately the same altitude (about 4 R♃). This is due to the fact that both planetesimals approach the planet’s core at a velocity v approximately equal to the escape velocity. This means that they are exposed to approximately the same stagnation pressure (≈1/2ρv2 where ρ is the atmospheric gas density). However, the head-on case penetrates about 0.5 R♃ deeper, since its velocity vector only has a radial component towards the core, while the mean case has a substantial tangential (along-orbit) component. The critical case differs in the sense that its velocity is given by the Keplerian velocity around the planet and not the escape velocity, i.e., it is about a factor ![]() smaller. This means that the dynamic pressure becomes equal to the planetesimal’s tensile strength only in a deeper layer. Because of this, the terminal explosion occurs at a somewhat lower altitude (about 3.5 R♃), but since the radial component of the velocity vector is only very low, the radial range over which the mass is deposited is very thin, as can be seen in Fig. A.2. In this mass deposition profile, one also clearly sees the consequences of the orbits around the planet before the final destruction. It leads to an increase in the mass deposition of about one, and, at special radii, two orders of magnitude. There is for example a local maximum at about 7 R♃. Clearly, this corresponds to the region around the capture radius, where the planetesimal makes many orbital passes.
smaller. This means that the dynamic pressure becomes equal to the planetesimal’s tensile strength only in a deeper layer. Because of this, the terminal explosion occurs at a somewhat lower altitude (about 3.5 R♃), but since the radial component of the velocity vector is only very low, the radial range over which the mass is deposited is very thin, as can be seen in Fig. A.2. In this mass deposition profile, one also clearly sees the consequences of the orbits around the planet before the final destruction. It leads to an increase in the mass deposition of about one, and, at special radii, two orders of magnitude. There is for example a local maximum at about 7 R♃. Clearly, this corresponds to the region around the capture radius, where the planetesimal makes many orbital passes.
It is interesting to compare the cumulative mass deposition profile with the altitude Revap where the ambient temperature of the atmosphere is sufficiently high to evaporate silicate grains. This altitude occurs at about 5 R♃ in the deep deposition case (see the “evap” line in Fig. 1). We neglect here that this distance is itself dependent on the opacity and thus the mass deposition profile. Planetesimal material that is deposited above this height can contribute to grain formation. We find that about 0.2% and 8% of the planetesimal’s initial mass is deposited above this distance in the mean and critical impact geometry, respectively. At crossover, the gas accretion rate is about a factor of 5 higher than the solid accretion rate (Pollack et al. 1996). Assuming an fD/G,disk = 0.01, this means that the ratio of the effective grain accretion rate due to planetesimals relative to the grain accretion rate together with the gas is about 0.04 and 1.6, again for the mean and critical geometry. We conclude that in the typical impact geometry, grain accretion together with the gas is clearly dominant so that the deep deposition assumption is indeed justified, while for the critical geometry both sources have approximately the same importance in the lower atmospheric layers. It is clear that we have here only analyzed an individual case. A systematic study is certainly warranted for future work.
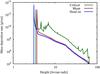 |
Fig. A.2
Consequence of the impact geometry on the radial mass deposition profile of 100 km icy planetesimals. The mass deposition per length as a function of height above the planet’s center is shown for a head-on collision (same line as in Fig. 1) and for the critical and mean impact parameter (corresponding to the trajectories shown in Fig. A.1). |
| Open with DEXTER | |
Appendix B: Planetesimal mass deposition: planetesimal composition
In this section we investigate the consequences of the planetesimal composition (ices versus silicates) for the radial mass deposition profile. One expects that icy planetesimals deposit much more mass in the upper layers compared to rocky impactors (Podolak et al. 1988). In this section we confirm this general result, but we also find that the extent and cause of the difference can vary substantially depending on the impactor size.
As in the previous section, we study the radial mass deposition profile in the Σ10 case at the crossover point. We note that the atmospheric structures at this moment are not identical for different planetesimal sizes and compositions as the planet’s accretion history depends on these quantities (e.g., Pollack et al. 1996). Figure B.1 shows the radial profiles for planetesimals made of silicates for a head-on and critical impact geometry and for initial planetesimal sizes of 100 km, 1 km, and 10 m. The curves for the last two were scaled such that the total mass deposited is the same as in the 100 km case. The profiles of head-on icy impactors, the same as in Fig. 1, are also shown for comparison.
|
Fig. B.1
Radial mass deposition profiles of 100 km (left), 1 km (center), and 10 m planetesimals (right panel). The 1 km and 10 m curves are scaled so that the total mass deposition is the same as in the 100 km case. The planetesimal material and impact geometry is indicated in the plot. The head-on impact of icy planetesimals is the same as shown in Fig. 1. The curves for 1 km and 10 m rocky planetesimals lay partially on top of each other for the two impact geometries. |
|
| Open with DEXTER | |
Three material properties are mainly responsible for the differences: the density (set to 1 and 3.2 g/cm2 for ice and silicate, respectively), the tensile strength (4×10⁶ and 3.5 ×10⁸ dyn/cm2, Svetsov et al. 1995), and the surface temperature where thermal ablation becomes important. This temperature depends on the vapor pressure law and is in the range 1300–2000 K for silicates (Opik 1958) and 180–220 K for ices (Iseli et al. 2002).
The left panel shows the mass deposition of 100 km impactors. For both compositions, the impact ends in a terminal explosion. We see that it occurs for rocky planetesimals at about 2 R♃ instead of about 3 R♃ as for the icy impactors. This is a direct consequence of the different tensile strengths. The difference between the head-on and critical geometry is quantitatively equivalent as found in Fig. A.2 for icy planetesimals. One also notes that in contrast to icy bodies, no mass at all is lost outside of about 10 R♃. This is a direct consequence of the higher temperature necessary for thermal ablation. For such large bodies, the main energy input driving ablation is shock wave radiation since before the terminal explosion, such big bodies always travel at a hypersonic velocity. The terminal explosion happens far below the altitude where the background atmosphere is hot enough to vaporize silicate grain (Revap ≈ 5 R♃), and pure thermal ablation is inefficient for such large bodies. This is due to the low heat transfer coefficient and the low surface-to-mass ratio. Therefore, only about 0.02% and 2% of the initial mass of the planetesimal could potentially contribute to grain formation. Grain accretion together with the gas is therefore clearly the dominant source in this scenario and the deep deposition scenario applies.
The case of 1 km planetesimals (middle panel) is different. Here, the change of the material properties (namely the higher tensile strength) leads to a fundamentally different character of the impact. For icy composition, the 1 km planetesimal gets aerodynamically disrupted as is the case for the 100 km impactors, so that it does not penetrate deeper than 3–4 R♃. Initially, the rocky impactor also travels at a hypersonic velocity. Therefore the thermal mass loss starts at the same height as in the 100 km case (≈10 R♃), but due to the lower surface-to-mass ratio, the 1 km planetesimal undergoes a stronger deceleration at higher altitudes. This means that it never flies at a very high velocity in the dense lower layers. Therefore, the dynamic pressure never overcomes the tensile strength of the silicate impactor (but it does so for ice). The silicate impactor thus does not undergo aerodynamic disruption. Instead, it is slowed down to terminal velocity where the drag and gravitational force are in equilibrium. It then sinks down at subsonic velocity, undergoing thermal ablation only due to the ambient radiation. Pure thermal ablation is still relatively inefficient for a 1 km sized body. Therefore, this impactor penetrates surprisingly deep into the envelope, namely to about 0.7 R♃, much deeper than larger (and smaller) bodies. Such 1 km silicate planetesimals thus belong to the class of intermediate-sized objects that are too small to undergo violent aerodynamical fragmentation, but too large to be efficiently thermally ablated. They therefore have a surprisingly large penetration depth and form a “core-hit finger” (see Mordasini et al. 2006).
The critical impact makes about nine orbits around the protoplanet before destruction. This is, however, not visible in the mass deposition profile as the temperature is too low in this part of the orbit. Ablation only sets in once the planetesimal is slowed down to terminal velocity and then radially sinks towards the core. Therefore, the mass deposition profile is nearly identical to the head-on case.
The 10 m impactor is shown in the right panel of Fig. B.1. One sees that the mass deposition profile of silicate impactors significantly differs from that of icy bodies. Mass loss only occurs in a small annulus between 4–5 R♃. Such small bodies are slowed down to terminal velocity relatively high in the atmosphere (both for a head-on and critical impact geometry) and then radially sink down undergoing thermal ablation due to ambient radiation. This is the same fundamental type of impact without aerodynamic disruption as for 1 km silicate planetesimals. The difference is that the 1 km body is initially heated by shock wave radiation and thus also loses some mass farther up in the atmosphere (but still only within 10 R♃). The 10 m object in contrast starts to lose mass only at about 5 R♃ where the undisturbed atmosphere become hot enough. It is not a coincidence that this is the same altitude as where silicate dust grains start to evaporate (Revap). This means that this small silicate body does not contribute any material that can form grains (at least in our approximation that no mechanical mass loss occurs at aerodynamic loads smaller than the tensile strength). This is an interesting result. It indicates that for protoplanets inside the iceline that accrete pebbles, accretion of grains together with the gas is the only source of material for grain opacity. Thus, again the deep deposition approximation would apply here.
The large diversity of planetesimal impact scenarios in terms of destruction mechanisms, penetration depths, or the importance of the impact geometry and the implications for the mass deposition profile will be studied in a systematic way in future work.
Appendix C: Determination of the grain size including the gas-grain relative velocity
In the analytical model, we consider two limiting cases, namely that the gas envelope is completely static (settling regime), or that the grains move at the full velocity of the gas (advection regime). This has the advantage that the grain size and thus opacity can be determined completely analytically. In this paragraph we demonstrate how the relative velocity of the gas to the grains can be included directly in the determination of the grain size. The disadvantage is that the grain size can then only be determined by a numerical root search in each layer. On the other hand, it is then also possible to smoothly combine the two drag regimes into one single equation.
The comparison of the equations for the drag force in the Epstein and Stokes regimes shows that the two can be combined into one expression that reduces to the two separate expressions in the limits of very high or low Knudsen numbers (see Nayakshin 2010). Writing this drag law in terms of the relative velocity v − vgas and equating with the gravitational force then yields terminal grain velocity vtrav. It is given as 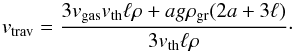 (C.1)From this we get the timescale on which grains traverse one scale height, τtrav = H/vtrav. This expression is valid both in the Epstein and Stokes regimes, and for settling and advection that had to be treated separately above. One thus has
 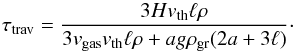 (C.2)For vgas = 0, this reduces to Eqs. (11) and (15) in the appropriate limits of the Knudsen number, while for a sufficiently high gas velocity it approaches τadv = H/vgas.
|
Fig. C.1
Left panel: grain size as a function of height for different growth mechanisms in the MP08 comparison case. The plot shows the size caused by growth by Brownian motion coagulation (dotted) and differential settling (solid) as predicted by the analytical expressions and by solving numerally for the grain size. Right panel: corresponding grain opacity. |
|
| Open with DEXTER | |
Combining the expression for the growth timescale in the Brownian motion regime (Eq. (19)) with the expression for vtrav and assuming again a radially constant grain flux yields the growth timescale 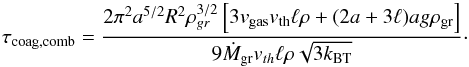 (C.3)For vgas = 0, this equation reduces to τcoag,S (Eq. (20)) for small grains and τcoag,E (Eq. (25)) for large ones, while for high gas velocities it approaches Eq. (43).
For growth by differential settling, we can combine the growth timescale in the Epstein and Stokes regime into the equation 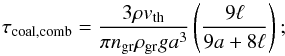 (C.4)with Eqs. (5), (7), and (C.1) this becomes
 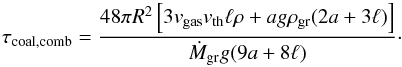 (C.5)It is straightforward to show that this expression reduces to Eq. (31), (37), (47), and (50) in the appropriate limits.
To determine the grain size, one again sets Eq. (C.2) equal to Eq. (C.3) and (C.5) and numerically determines the grain size a in the two regimes. Once it is determined, the process with the shorter timescale is chosen and the other quantities like in particular the opacity can be calculated in an analogous way as in the analytical model.
The left panel of Fig. C.1 shows the grain size in the atmosphere of the MP08 comparison case (Fig. 3), comparing the size as found by the analytical expressions and the numerical solution for a. In the entire atmosphere, growth by differential settling is found to occur on a shorter timescale than by Brownian motion (Fig. 4), leading to grains that are about one order of magnitude larger. The grain size found analytically for differential settling is therefore the same as shown in Fig. 8. In this atmosphere, the advection regime as defined by a τadv that is smaller than the growth timescale for vgas = 0 does not occur. Therefore, advection is completely neglected in the analytical model. The figure shows that this leads to grain sizes that are slightly overestimated relative to the result when numerically solving for a. Here the small, but non-zero vgas = 0 is properly taken into account with the consequence that grains cross one scale height on a somewhat shorter timescale. This reduces their grain size. We also see that the transition from the Epstein to the Stokes regime (at about 7 × 1010 cm) occurs smoothly in the numerical solution, while at least for Brownian coagulation, a small kink is visible in the analytical model. Both these differences between the analytical and numerical models are expected.
The right panel of the figure shows that the effect on the resulting opacity (that given by growth due to differential settling) is, however, very small. Only a small increase occurs in the outer layers which does not contribute much to the total optical depth. This justifies our neglecting of advection in the analytical model for this atmosphere. The grain opacity in the upper layers as predicted from Brownian motion coagulation is lower in the numerical model. This comes from the decrease of Q for smaller grains. In the inner parts, the opacity is almost identical. This is a consequence of the fact that the non-zero vgas not only decreases the grain size, but also reduces the grain concentration.
To understand the global effects, we have recalculated the Σ10 and Σ4 cases, determining a numerically. We found that the difference is very small. For the Σ10 case, the crossover time is somewhat longer relative to the analytical model as expected, but only by about 10%. For the Σ4 simulation, the difference virtually vanishes (less than 1%). This shows again that advection is more important for more massive cores. It also means that it is not necessary to numerically solve for a, at least before crossover and for cores that are not much more massive than in the Σ10 case.
Appendix D: Differential settling and Brownian motion in the advection regime
Figure D.1 shows the grain sizes a function of height at crossover in the Σ10 case. The density and temperature of MBPL10 shown in Fig. 11 is used to calculate the grain sizes together with a gas accretion rate of ṀXY = 1.8 × 10⁻⁴M⊕/yr. In this atmosphere, the analytical model finds that the growth timescale by differential settling τcoal,E becomes longer than the advection timescale τadv outside of about 3.8 × 1011 cm. This is indicated by a vertical gray line. Grain growth by differential settling neglecting the effect of envelope contraction (blue dashed line) leads to quite large grains of about 0.01 cm. In contrast, grain growth by Brownian motion coagulation in the advection regime (blue dash-dotted line) is inefficient, so that grains remain at their smallest allowed size of 1 μm. The black line shows the combined interpolated grain size. The brown solid line shows the grain size if no lower limit of 1 μm is imposed. Then the grains would have an even slightly smaller size of ≳0.7 μm.
The green solid line shows the grain size according to Eq. (49) for growth by differential settling in the advection regime. It shows that at least according to the description in Sect. 2.5.6, it does not seem to be an extremely efficient process. While it does predict larger grain sizes, the difference to Brownian motion is only about a factor of 2 or 3. In the normal regime (no advection), the grains formed by differential settling (coalescence) are, in contrast, typically one order of magnitude larger than for Brownian motion. This means that even if coalescence is included in the advection regime, there is no large effect (reduction) of the opacity predicted by the analytical model in the outermost layers, at least with the description used here. While the effect of advection before runaway is small, we will nevertheless investigate this regime further (Ormel & Mordasini, in prep.).
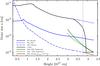 |
Fig. D.1
Grain size as a function of height for different growth mechanisms at crossover in the MBPL10 case (initial planetesimal surface density of 10 g/cm2). |
| Open with DEXTER | |
Equation (49) gives an estimate of the grain size because of differential settling in the advection regime involving an integral. For completeness, we also give an analytical expression in this regime using that the temperature is roughly constant in the outermost layers (see Figs. 3 and 11) while the density decreases rapidly towards the exterior roughly as r-4. One can then calculate the integral (which gives the column density) to find 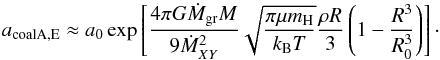 (D.1)The grain size obtained with this equation is also shown in Fig. D.1 with the green dashed line where it provides a good approximation to the numerical result. It is, however, clear that this equation is not generally applicable, as it requires an a priori knowledge of the temperature and density structure.
© ESO, 2014
Current usage metrics show cumulative count of Article Views (full-text article views including HTML views, PDF and ePub downloads, according to the available data) and Abstracts Views on Vision4Press platform.
Data correspond to usage on the plateform after 2015. The current usage metrics is available 48-96 hours after online publication and is updated daily on week days.
Initial download of the metrics may take a while.