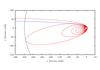
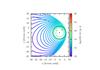
Fig. A.1

Left panel: trajectories of 100 km icy planetesimals in the envelope of the protoplanet in the Σ10 case at crossover for two different impact parameters. The critical case (red) and the mean case (blue) are shown. The three concentric black circles are the Hill sphere, capture, and core radius (from large to small). Right panel: zoom-in onto the central regions of the two trajectories. The color code gives the instantaneous mass loss rate along the trajectory. Almost all of the mass is deposited in the terminal explosion (red parts of the trajectory). The black circles are again the capture and core radius.
Current usage metrics show cumulative count of Article Views (full-text article views including HTML views, PDF and ePub downloads, according to the available data) and Abstracts Views on Vision4Press platform.
Data correspond to usage on the plateform after 2015. The current usage metrics is available 48-96 hours after online publication and is updated daily on week days.
Initial download of the metrics may take a while.