| Issue |
A&A
Volume 571, November 2014
|
|
|---|---|---|
| Article Number | A69 | |
| Number of page(s) | 23 | |
| Section | Extragalactic astronomy | |
| DOI | https://doi.org/10.1051/0004-6361/201424747 | |
| Published online | 10 November 2014 | |
Online material
Appendix A: The effect of model degeneracies
Appendix A.1: Relative dust-stellar scale heights
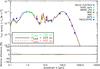 |
Fig. A.1
Effect on the model SED (top) derived from the RT simulations for M 51 assuming a dust scale height hz,d = 150, 225 and 450 pc or, thus, a dust-to-stellar scale height of |
| Open with DEXTER | |
In Sect. 3.2.1, we describe our model assumptions for the relative star-dust geometry in M 51 based on observations of edge-on galaxies for which the stellar and dust geometries can be vertically resolved. Since the relative geometry of stars and dust has been shown to affect the derived attenuation (e.g., Disney et al. 1989; Ferrara et al. 1999), we aim to analyze the model implications regarding our assumptions on the relative dust-star geometry. Figure A.1 shows the model SEDs (top) and relative difference between the model SEDs (bottom) for a RT model of M 51 with dust scale height hz,d = 150, 225 and 450 pc, or a dust-to-stellar scale height of  ,
,  and 1, respectively.
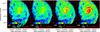 |
Fig. A.2
FUV attenuation map for M 51 as derived from observations (left), for the RT model exploited in this paper with dust scale height hz,d = 150 pc (second panel), hz,d = 225 pc (third panel) and hz,d = 450 pc (last panel). |
| Open with DEXTER | |
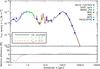 |
Fig. A.3
Effect on the model SED (top) derived from the RT simulations for M 51 assuming a two-phase dust component with a clump fraction fcl of 0, 0.2 and 0.5, representative for the relative fraction of dust mass distributed in clumps, indicated as a black solid, green dotted and red dashed line, respectively. The bottom panel shows the relative SEDs for RT models with clump fractions fcl = 0.2 (green dotted line) and fcl = 0.5 (red dashed line) compared to the RT model with a smooth dust component, which was used for the analysis in this paper. |
| Open with DEXTER | |
The difference between the three RT models with different dust scale heights is limited to the UV and far-infrared wavelength domain, while the optical wavebands do not reveal a clear dissimilarity between the observed SEDs. The FUV emission decreases for RT models with increasing dust scale heights, i.e., dust scale heights that approach the vertical scale height of stars, suggesting that more FUV emission is absorbed for dust components distributed in a thicker disk. Comparing the three models, the UV absorption increases from ~75% to 78% and 81% for dust scale heights of hz,d = 150, 225 and 450 pc, respectively. The scattered fraction of UV light, on the other hand, slightly decreases from 12% to 11%. The total amount of absorbed stellar energy (i.e., 10% of the total stellar bolometric luminosity) remains invariable for the three RT models, which confirms earlier results reported by Beckman et al. (1996) and Tuffs et al. (2004) that the relative dust-star geometry does not severely affect the attenuation (except in UV wavebands). The increased absorption of UV light for RT models with longer dust scale heights translates in brighter PAH features and increased mid-infrared emission. The differences between the three RT models with variation in dust scale heights at infrared wavebands are limited to ~10%, and, therefore, will not have a significant effect on the RT model parameters.
Figure A.2 shows the observed (first panel) and model images of the FUV dust attenuation in M 51 for RT models with dust scale height hz,d = 150 pc (second panel), hz,d = 225 pc (third panel), and hz,d = 450 pc (last panel). From the FUV attenuation maps, we can derive that the absorbed FUV fraction is indeed higher/lower for larger/smaller dust scale heights. Since an adjustment of the dust mass would be necessary to reproduce the observed FUV attenuation map for RT models with dust scale heights hz,d = 150 and 450 pc, respectively, we will not longer reproduce the observed FIR/submm observations of M 51. We, therefore, argue that the assumed relative dust-to-stellar scale height hz,d/hz, ⋆ = 0.5 provides a good representation of the true vertical distribution of stars and dust in M 51. We do need to be cautious regarding uncertainties on the assumed dust model parameters, i.e., deviations from the assumed dust opacity κ, and its variation with wavelength (e.g., Tabatabaei et al. 2014; Gordon et al. 2014), which will reflect in a similar uncertainty on the dust mass determination, FUV attenuation, and dust emission in IR/submm wavebands.
Appendix A.2: Clumpiness of dust
The RT model of M 51 does not include any effects of clumpy dust in addition to the 2D asymmetry derived from the FUV attenuation map to describe the dust geometry. To analyze the effects of dust clumping on the RT model results for M 51, we introduce a two-phase geometry in our radiative transfer code SKIRT characterized by a diffuse and clumpy phase. The two-phase component is conditioned through three parameters: the number of clumps, the size of individual clumps, and the clump fraction, i.e., the fraction of the dust mass that is locked up in clumps with the remaining mass distributed in the diffuse medium. Rather than using a density ratio between the clumps and diffuse medium, we model the clumpy regions using a Cubic Spline Smoothing kernel W(r,h) to describe the density of the two-phase medium: 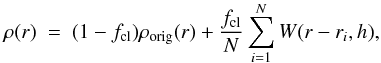 (A.1)with N = the number of clumps, ρorig = the original density, fcl = the fraction of mass locked up in clumps, r = the 3D position in the dust grid, and h = the scale radius of a single clump. The clumps with their centers at position ri are distributed stochastically throughout the diffuse medium relying on the probability density distribution function representative of the dust component.
Similar to the two-phase clumpy medium applied by Bianchi (2008), the clumps in our model are assumed to have sizes similar to the giant molecular clouds observed in our Milky Way. Based on the largest cloud mass of 106.5M⊙ (Reach et al. 2005) and assuming a typical surface density Σ = 100M⊙ pc-2 observed in Local Group galaxies (Rosolowsky et al. 2003; Blitz et al. 2007), we derive a corresponding radius of R ~ 100 pc. The number of dust clumps of a single mass depends on the gas-to-dust ratio (G/D) and the clump fraction fcl through:  (A.2)The gas-to-dust ratio is assumed to be around ~105, following the calculations from Mentuch Cooper et al. (2012).
Figure A.3 shows the model SEDs (top), and relative difference between the SEDs (bottom) for radiative transfer simulations with a two-phase dust component consisting of a smooth medium with superimposed a fraction of clumps representing 0% (equivalent to no clumps), 20%, and 50% of the total dust mass, indicated in black solid, green dotted, and red dashed lines, respectively. With increasing clump fractions, the dusty medium becomes more transparent, resulting in increased UV and optical emission of stars in the RT model. The total amount of stellar light that is absorbed by dust decreases from 10% to 7% going from a smooth to clumpy medium with fcl = 0.5, while the amount of stellar photons that is scattered by the dust medium decreases from 18% to 15%. The diminished absorption rate is most apparent in the UV wavebands with UV absorption fractions decreasing from 75% to 55% going from a smooth to clumpy media with fcl = 0.5. The UV scattering, on the other hand, increases from about 10% to 15−20% from a smooth to clumpy medium with half of the dust mass distributed in clumps. The clumping fraction of dust has, thus, a direct impact on the UV absorption and scattering rates, which also affects the shape of the 2175 Å feature (see bottom panel of Fig. A.3). In addition to variations in the grain composition and/or size distribution, the clumping of dust might play an important role in explaining the shape of the dust bump at 2175 Å.
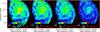 |
Fig. A.4
FUV attenuation map for M 51 as derived from observations (left), for the RT model exploited in this paper with smooth dust component (second panel) and the RT model with a two-phase dust component with clump fractions fcl = 0.2 (third panel) and fcl = 0.5 (last panel). |
| Open with DEXTER | |
The transparency of the ISM in clumpy media reduces the absorbed stellar energy, which is reflected in a decrease of the infrared and (sub)millimeter emission with about ~10−15% long wards of 60 μm. Similar effects of dust clumping have been shown in RT simulations presented by Bianchi et al. (2000); Pierini et al. (2004); Baes et al. (2011). The decreased dust emission could be compensated for by increasing the dust mass in the RT model, but would still underestimate the FUV attenuation derived for M 51 by ~40% (see Fig. A.4). We, therefore, argue that the 2D structure from the FUV attenuation map, constructed based on FUV and infrared observations, provides an adequate description of the 3D asymmetry in the distribution of dust in M 51. The underestimation of the FUV attenuation upon including a two-phase dust component with clumps suggests that M 51 likely does not contain many compact dust clouds without embedded sources. This result for M 51 differs from the substantial fractions of compact dust clumps needed to explain the FIR/submm emission observed in NGC 891 (fcl = 0.5, Bianchi 2008), NGC 4594 (fcl = 0.75, De Looze et al. 2012a) and NGC 4565 (fcl = 0.67, De Looze et al. 2012b). A first difference between these galaxies and M 51 is their edge-on view, which does not allow to constrain the 3D structure of stars and dust as we did for M 51, and might, therefore, introduce uncertainties into the model. A second explanation might be the difference in galaxy type between the former galaxies and M 51. In late-type galaxies such as M 51 (SAbc), we expect to find star-forming regions with embedding young stars, while the early-type galaxies (Sa-Sb) likely have lower levels of star formation activity, with several compact gaseous clouds where star formation has not (yet) been ignited. The study of a bigger sample of face-on galaxies will be necessary to disentangle between the effects of inclination and galaxy type in explaining the need for compact quiescent dust clouds.
© ESO, 2014
Current usage metrics show cumulative count of Article Views (full-text article views including HTML views, PDF and ePub downloads, according to the available data) and Abstracts Views on Vision4Press platform.
Data correspond to usage on the plateform after 2015. The current usage metrics is available 48-96 hours after online publication and is updated daily on week days.
Initial download of the metrics may take a while.