Free Access
Fig. A.4
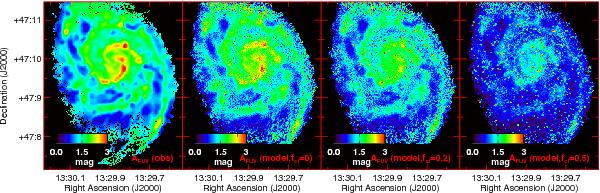
FUV attenuation map for M 51 as derived from observations (left), for the RT model exploited in this paper with smooth dust component (second panel) and the RT model with a two-phase dust component with clump fractions fcl = 0.2 (third panel) and fcl = 0.5 (last panel).
Current usage metrics show cumulative count of Article Views (full-text article views including HTML views, PDF and ePub downloads, according to the available data) and Abstracts Views on Vision4Press platform.
Data correspond to usage on the plateform after 2015. The current usage metrics is available 48-96 hours after online publication and is updated daily on week days.
Initial download of the metrics may take a while.