Fig. A.3
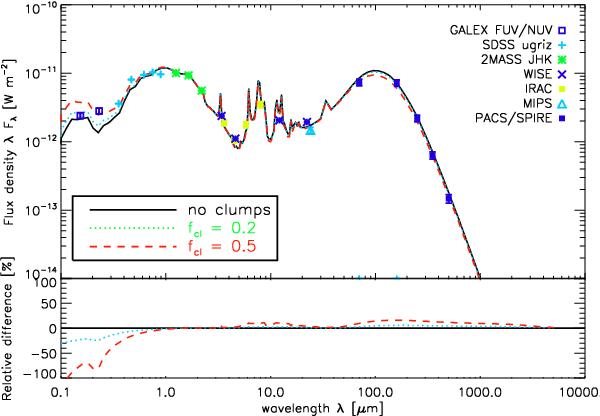
Effect on the model SED (top) derived from the RT simulations for M 51 assuming a two-phase dust component with a clump fraction fcl of 0, 0.2 and 0.5, representative for the relative fraction of dust mass distributed in clumps, indicated as a black solid, green dotted and red dashed line, respectively. The bottom panel shows the relative SEDs for RT models with clump fractions fcl = 0.2 (green dotted line) and fcl = 0.5 (red dashed line) compared to the RT model with a smooth dust component, which was used for the analysis in this paper.
Current usage metrics show cumulative count of Article Views (full-text article views including HTML views, PDF and ePub downloads, according to the available data) and Abstracts Views on Vision4Press platform.
Data correspond to usage on the plateform after 2015. The current usage metrics is available 48-96 hours after online publication and is updated daily on week days.
Initial download of the metrics may take a while.