| Issue |
A&A
Volume 570, October 2014
|
|
|---|---|---|
| Article Number | A123 | |
| Number of page(s) | 11 | |
| Section | Extragalactic astronomy | |
| DOI | https://doi.org/10.1051/0004-6361/201424050 | |
| Published online | 31 October 2014 | |
Online material
Appendix A: Additional material
We display in Fig. A.1 the 204 measured fblue values, as a function of galaxy stellar mass M, cluster-centric distance r/r200, for our three cluster mass bins along with our fitted model. We notice that there are few points that are more than ~2σ away from the model, which is expected when there are 204 measurements.
We display in Fig. A.2 the computed posterior for the γQ coefficient of Eq. (2) for Q in: cluster mass log (M200/M⊙), cluster richness log (N200), cluster iron abundance Z/Z⊙, and cluster central cooling time log (CCT / Gyr). For each quantity Q, we report the point estimate and the 68% confidence interval.
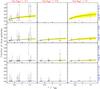 |
Fig. A.1
fblue for individual clusters as a function of cluster-centric distance (r/r200) for different bins of cluster mass log(M200/M⊙) (increasing right-ward) and galaxy stellar mass (increasing down-ward). Error bars mark the shortest interval including 68% of the posterior values, and are plotted as a dashed line when this interval is larger than 0.66, indicating that fblue is very poorly constrained. Yellow shaded areas represent the posterior mean and error of the model of Eq. (2), fitting the 204 individual fblue measurements. Radial cluster-centric bins are indicated by grey filled triangles on the x-axis and horizontal grey dashed lines limit the whole fblue range. |
| Open with DEXTER | |
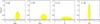 |
Fig. A.2
Computed posterior for the γQ coefficient of Eq. (2). From left to right, Q stands for: cluster mass log (M200/M⊙), cluster richness log (N200), cluster iron abundance Z/Z⊙, and cluster central cooling time log (CCT / Gyr). The posterior is the black histogram and the prior the blue histogram, close to the x-axis. The yellow shaded area represents the 68% interval. For each quantity Q, we report the point estimate and the 68% interval. |
| Open with DEXTER | |
© ESO, 2014
Current usage metrics show cumulative count of Article Views (full-text article views including HTML views, PDF and ePub downloads, according to the available data) and Abstracts Views on Vision4Press platform.
Data correspond to usage on the plateform after 2015. The current usage metrics is available 48-96 hours after online publication and is updated daily on week days.
Initial download of the metrics may take a while.