Fig. A.2
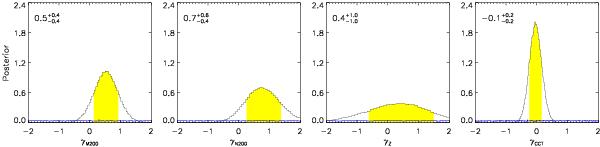
Computed posterior for the γQ coefficient of Eq. (2). From left to right, Q stands for: cluster mass log (M200/M⊙), cluster richness log (N200), cluster iron abundance Z/Z⊙, and cluster central cooling time log (CCT / Gyr). The posterior is the black histogram and the prior the blue histogram, close to the x-axis. The yellow shaded area represents the 68% interval. For each quantity Q, we report the point estimate and the 68% interval.
Current usage metrics show cumulative count of Article Views (full-text article views including HTML views, PDF and ePub downloads, according to the available data) and Abstracts Views on Vision4Press platform.
Data correspond to usage on the plateform after 2015. The current usage metrics is available 48-96 hours after online publication and is updated daily on week days.
Initial download of the metrics may take a while.