Fig. A.1
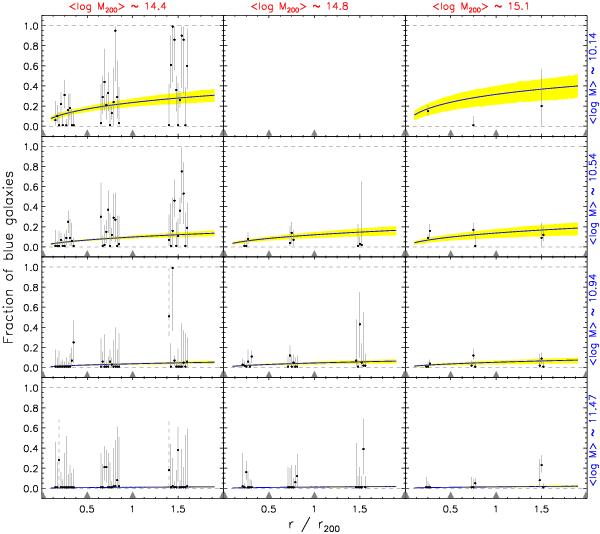
fblue for individual clusters as a function of cluster-centric distance (r/r200) for different bins of cluster mass log(M200/M⊙) (increasing right-ward) and galaxy stellar mass (increasing down-ward). Error bars mark the shortest interval including 68% of the posterior values, and are plotted as a dashed line when this interval is larger than 0.66, indicating that fblue is very poorly constrained. Yellow shaded areas represent the posterior mean and error of the model of Eq. (2), fitting the 204 individual fblue measurements. Radial cluster-centric bins are indicated by grey filled triangles on the x-axis and horizontal grey dashed lines limit the whole fblue range.
Current usage metrics show cumulative count of Article Views (full-text article views including HTML views, PDF and ePub downloads, according to the available data) and Abstracts Views on Vision4Press platform.
Data correspond to usage on the plateform after 2015. The current usage metrics is available 48-96 hours after online publication and is updated daily on week days.
Initial download of the metrics may take a while.