| Issue |
A&A
Volume 570, October 2014
|
|
|---|---|---|
| Article Number | A33 | |
| Number of page(s) | 17 | |
| Section | Stellar structure and evolution | |
| DOI | https://doi.org/10.1051/0004-6361/201423669 | |
| Published online | 10 October 2014 | |
Online material
Appendix A: Amplitude and phase profiles
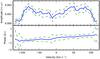 |
Fig. A.1
Amplitude (upper panel) and phase (lower panel) across the line for frequency f8 = 6.6801 d-1. Observations are shown as the blue solid line and errors of the observations are shown as the green dashed line. |
| Open with DEXTER | |
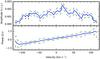 |
Fig. A.2
Same as Fig. A.1, but for frequency f9 = 4.0743 d-1. |
| Open with DEXTER | |
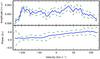 |
Fig. A.3
Same as Fig. A.1, but for frequency f10 = 6.1171 d-1. |
| Open with DEXTER | |
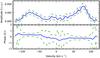 |
Fig. A.4
Same as Fig. A.1, but for frequency f11 = 6.975 d-1. |
| Open with DEXTER | |
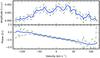 |
Fig. A.5
Same as Fig. A.1, but for frequency f12 = 10.1702 d-1. |
| Open with DEXTER | |
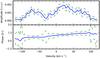 |
Fig. A.6
Same as Fig. A.1, but for frequency f13 = 6.1910 d-1. |
| Open with DEXTER | |
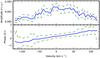 |
Fig. A.7
Same as Fig. A.1, but for frequency f14 = 12.4244 d-1. |
| Open with DEXTER | |
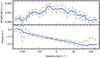 |
Fig. A.8
Same as Fig. A.1, but for frequency f15 = 9.4113 d-1. |
| Open with DEXTER | |
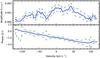 |
Fig. A.9
Same as Fig. A.1, but for frequency f16 = 9.7684 d-1. |
| Open with DEXTER | |
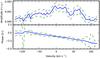 |
Fig. A.10
Same as Fig. A.1, but for frequency f17 = 10.0372 d-1. |
| Open with DEXTER | |
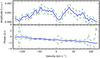 |
Fig. A.11
Same as Fig. A.1, but for frequency f18 = 6.4030 d-1. |
| Open with DEXTER | |
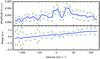 |
Fig. A.12
Same as Fig. A.1, but for frequency f19 = 13.388 d-1. |
| Open with DEXTER | |
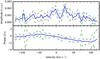 |
Fig. A.13
Same as Fig. A.1, but for frequency f20 = 10.016 d-1. |
| Open with DEXTER | |
Appendix B: Comparison of LSD profiles and single-line profiles
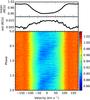 |
Fig. B.1
Upper panel: mean profile of the Fe ii line at 4508.288 Å in the season 2010. Center panel: standard deviation of the Fe ii line. Lower panel: color image of the LPVs of the Fe ii line, phase folded on the frequency f1 = 7.3764 d-1. The amplitude is color coded and can be read from the color bar. |
| Open with DEXTER | |
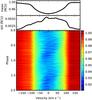 |
Fig. B.2
Same as Fig. B.1 for the standard LSD profiles calculated from all lines in the line mask. |
| Open with DEXTER | |
 |
Fig. B.3
Same as Fig. B.1 for the LSD profiles calculated from all Fe lines in the line mask only. |
| Open with DEXTER | |
Appendix C: Results of the mode identification of f1 = 7.3764 d-1 and f2 = 5.8496 d-1
Results of the mode identification using set 1 of the stellar parameters (M = 2.0 M⊙, R = 3.72 R⊙, log g = 3.6, and Teff = 7050 K).
Results of the mode identification using set 2 of the stellar parameters (M = 1.5 M⊙, R = 3.75 R⊙, log g = 3.45, and Teff = 6950 K).
Results of the mode identification using set 3 of the stellar parameters (M = 2.4 M⊙, R = 5.6 R⊙, log g = 3.32, and Teff = 6800 K).
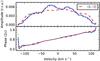 |
Fig. C.1
Fit of the amplitude (upper panel) and phase (lower panel) across the line of the frequency f1 with a (ℓ,m) = (3, − 2) mode. The observed profiles are calculated from the phase folded data set. Observations are shown as the blue solid line, the errors of the observations are shown as the green dash-dotted line, and the fit is shown as the red dashed line. The fit has a χ2 of 28.6. |
| Open with DEXTER | |
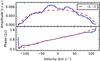 |
Fig. C.2
Same as Fig. C.1, but with a (ℓ,m) = (3, − 3) mode. The fit has a χ2 of 29.7. |
| Open with DEXTER | |
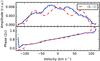 |
Fig. C.3
Same as Fig. C.1, but with a (ℓ,m) = (3, − 1) mode. The fit has a χ2 of 34.6. |
| Open with DEXTER | |
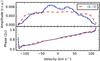 |
Fig. C.4
Same as Fig. C.1, but with a (ℓ,m) = (2, − 2) mode. The fit has a χ2 of 38.3. |
| Open with DEXTER | |
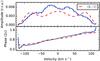 |
Fig. C.5
Same as Fig. C.1, but with a (ℓ,m) = (2, − 1) mode. The fit has a χ2 of 47.7. |
| Open with DEXTER | |
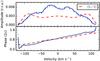 |
Fig. C.6
Same as Fig. C.1, but with a (ℓ,m) = (1, − 1) mode. The fit has a χ2 of 68.7. |
| Open with DEXTER | |
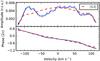 |
Fig. C.7
Fit of the amplitude (upper panel) and phase (lower panel) across the line of the frequency f2 with a (ℓ,m) = (3,3) mode. The observed profiles are calculated from the phase folded data set. Observations are shown as the blue solid line, the errors of the observations are shown as the green dash-dotted line, and the fit is shown as the red dashed line. The fit has a χ2 of 29. |
| Open with DEXTER | |
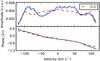 |
Fig. C.8
Same as Fig. C.7, but with a (ℓ,m) = (3,2) mode. The fit has a χ2 of 30.8. |
| Open with DEXTER | |
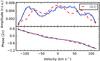 |
Fig. C.9
Same as Fig. C.7, but with a (ℓ,m) = (3,1) mode. The fit has a χ2 of 35.3. |
| Open with DEXTER | |
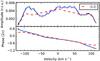 |
Fig. C.10
Same as Fig. C.7, but with a (ℓ,m) = (2,2) mode. The fit has a χ2 of 39.6. |
| Open with DEXTER | |
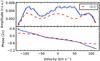 |
Fig. C.11
Same as Fig. C.7, but with a (ℓ,m) = (2,1) mode. The fit has a χ2 of 65.6. |
| Open with DEXTER | |
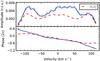 |
Fig. C.12
Same as Fig. C.7, but with a (ℓ,m) = (1,1) mode. The fit has a χ2 of 68.3. |
| Open with DEXTER | |
© ESO, 2014
Current usage metrics show cumulative count of Article Views (full-text article views including HTML views, PDF and ePub downloads, according to the available data) and Abstracts Views on Vision4Press platform.
Data correspond to usage on the plateform after 2015. The current usage metrics is available 48-96 hours after online publication and is updated daily on week days.
Initial download of the metrics may take a while.