Free Access
Fig. B.1
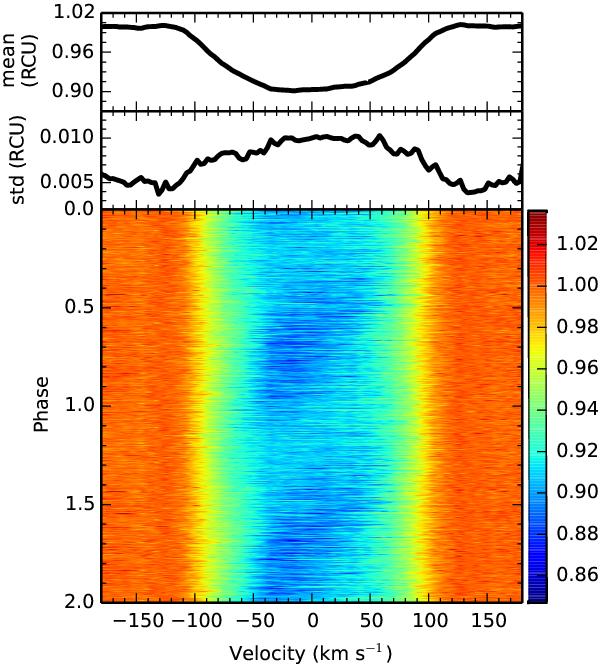
Upper panel: mean profile of the Fe ii line at 4508.288 Å in the season 2010. Center panel: standard deviation of the Fe ii line. Lower panel: color image of the LPVs of the Fe ii line, phase folded on the frequency f1 = 7.3764 d-1. The amplitude is color coded and can be read from the color bar.
Current usage metrics show cumulative count of Article Views (full-text article views including HTML views, PDF and ePub downloads, according to the available data) and Abstracts Views on Vision4Press platform.
Data correspond to usage on the plateform after 2015. The current usage metrics is available 48-96 hours after online publication and is updated daily on week days.
Initial download of the metrics may take a while.