Fig. C.7
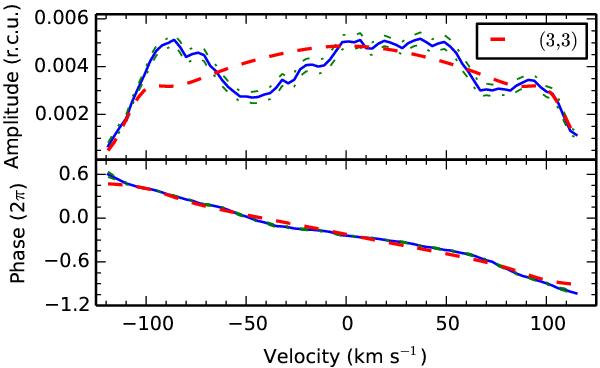
Fit of the amplitude (upper panel) and phase (lower panel) across the line of the frequency f2 with a (ℓ,m) = (3,3) mode. The observed profiles are calculated from the phase folded data set. Observations are shown as the blue solid line, the errors of the observations are shown as the green dash-dotted line, and the fit is shown as the red dashed line. The fit has a χ2 of 29.
Current usage metrics show cumulative count of Article Views (full-text article views including HTML views, PDF and ePub downloads, according to the available data) and Abstracts Views on Vision4Press platform.
Data correspond to usage on the plateform after 2015. The current usage metrics is available 48-96 hours after online publication and is updated daily on week days.
Initial download of the metrics may take a while.