| Issue |
A&A
Volume 567, July 2014
|
|
|---|---|---|
| Article Number | A27 | |
| Number of page(s) | 15 | |
| Section | The Sun | |
| DOI | https://doi.org/10.1051/0004-6361/201423789 | |
| Published online | 08 July 2014 | |
Online material
Appendix A: Anisotropy– and intensity–time profiles during three example events
In the following, we show three example events for the three anisotropy classes defined in Sect. 4.3. Multipoint observations of both STEREO spacecraft and ACE are shown for each of the three events in Figs. A.1 to A.3. The figures always present from top to bottom the time series of the intensity in color coding as a function of pitch angle, the pitch angle of each of the four SEPT telescopes, the 55–105 keV electron intensity as measured in the four telescopes, and the anisotropy.
Appendix A.1: Class-1 example: the SEP event on 17 May 2012
Figure A.1 presents observations of the event on 17 May 2012, which was the first ground-level enhancement (GLE) of solar cycle 24 (Heber et al. 2013; Gopalswamy et al. 2013; Papaioannou et al. 2014). While ACE (shown in the middle figure) was well connected to the source flaring AR (Φ = 16) and observed a clear anisotropic event, STEREO A and B were separated by 89 and 141 degrees. Although both STEREO spacecraft detected a significant intensity increase, both increases are rather isotropic.
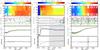 |
Fig. A.1
Anisotropy and intensity time profiles of the SEP event on 17 May 2012 observed by STEREO B (left), ACE (middle), and STEREO A (right). Anisotropy plotted in lighter color denotes periods of background intensity for which the anisotropy calculation is very uncertain. Gray shading in ACE observations marks a period where the electron measurements (and following the anisotropy) are contaminated by ions. The small shaded area in STEREO A measurements denotes a period of very poor pitch-angle coverage, which led to an incorrect anisotropy determination. |
| Open with DEXTER | |
Appendix A.2: Class-2 example: the SEP event on 11 April 2013
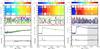 |
Fig. A.2
Anisotropy and intensity time profiles of the SEP event on 11 April 2013 observed by STEREO A (left), STEREO B (middle), and ACE (right). Anisotropy plotted in lighter color denotes periods of background intensity for which the anisotropy calculation is very uncertain. The gray-shaded area in the ACE plot marks a period of ion contamination. |
| Open with DEXTER | |
Figure A.2 shows the event on 11 April 2013 where an angular widely separated spacecraft (ACE) still observed significant anisotropy. Here, STEREO B (middle figure) is the best-connected spacecraft (Φ = 64), and ACE and STEREO A are separated by 77 and 153 degrees.
Appendix A.3: Class-3 example: the SEP event on 14 August 2010
The event shown in Fig. A.3 occurred on 14 August 2010. Although ACE (middle figure) was the best-connected spacecraft (Φ = −5°) and observed the highest intensity, and although the footpoint of STEREO B was 15° away from the flare longitude, STEREO B observed stronger anisotropy. The absolute highest anisotropy is 1.93, which is twice the value observed by ACE (1.05). Interestingly enough, STEREO A, separated by 92 degrees, observed no significant anisotropy during this event.
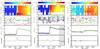 |
Fig. A.3
Anisotropy and intensity time profiles of the SEP event on 14 August 2010 observed by STEREO B (left), ACE (middle), and STEREO A (right). Anisotropy plotted in lighter color denotes periods of background intensity for which the anisotropy calculation is very uncertain. The gray-shaded area in ACE anisotropy and intensity marks a period of ion contamination that saturated the electron measurements and led to an incorrect anisotropy determination. |
| Open with DEXTER | |
© ESO, 2014
Current usage metrics show cumulative count of Article Views (full-text article views including HTML views, PDF and ePub downloads, according to the available data) and Abstracts Views on Vision4Press platform.
Data correspond to usage on the plateform after 2015. The current usage metrics is available 48-96 hours after online publication and is updated daily on week days.
Initial download of the metrics may take a while.