Fig. A.1
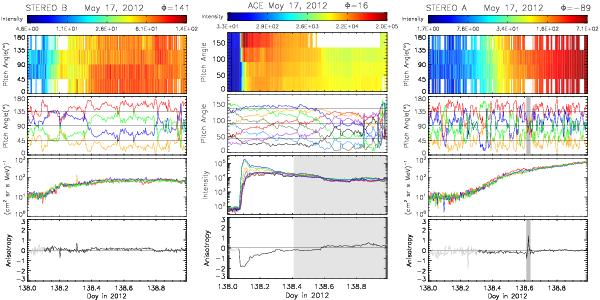
Anisotropy and intensity time profiles of the SEP event on 17 May 2012 observed by STEREO B (left), ACE (middle), and STEREO A (right). Anisotropy plotted in lighter color denotes periods of background intensity for which the anisotropy calculation is very uncertain. Gray shading in ACE observations marks a period where the electron measurements (and following the anisotropy) are contaminated by ions. The small shaded area in STEREO A measurements denotes a period of very poor pitch-angle coverage, which led to an incorrect anisotropy determination.
Current usage metrics show cumulative count of Article Views (full-text article views including HTML views, PDF and ePub downloads, according to the available data) and Abstracts Views on Vision4Press platform.
Data correspond to usage on the plateform after 2015. The current usage metrics is available 48-96 hours after online publication and is updated daily on week days.
Initial download of the metrics may take a while.