| Issue |
A&A
Volume 565, May 2014
|
|
|---|---|---|
| Article Number | A1 | |
| Number of page(s) | 19 | |
| Section | Astrophysical processes | |
| DOI | https://doi.org/10.1051/0004-6361/201322969 | |
| Published online | 18 April 2014 | |
Online material
Appendix A: Overview of the average PSDs at different spectral shapes
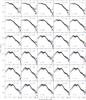 |
Fig. A.1
Overview of the average PSDs at different spectral shapes. PSDs are calculated on a logarithmically binned grid with df/f = 0.15. Each PSD is the average of all n PSDs falling within the Γ1 ± 0.01 interval for the given Γ1 values. Black stars show PSDs in the 2.1–4.5 keV band, red triangles in the 4.5–5.7 keV band, blue circles in the 5.7–9.4 keV, and green squares in the 9.4–15 keV band. The gray line represents the PSD in the total 2.1–15 keV band. |
| Open with DEXTER | |
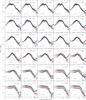 |
Fig. A.2
Overview of the average PSDs at different spectral shapes. PSDs are calculated on a logarithmically binned grid with df/f = 0.15. Each PSD is the average of all n PSDs falling within the Γ1 ± 0.01 interval for the given Γ1 values. Black stars show PSDs in the 2.1–4.5 keV band, red triangles in the 4.5–5.7 keV band, blue circles in the 5.7–9.4 keV, and green squares in the 9.4–15 keV band. The gray line represents the PSD in the total 2.1–15 keV band. The increase in the 2.1–4.5 keV PSDs seen at highest frequencies (especially for Γ1 = 2.61) is not a source-intrinsic effect, but is due to the high flux in this band and resulting telemetry overflow. |
| Open with DEXTER | |
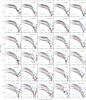 |
Fig. A.3
Overview of the average PSDs at different spectral shapes. PSDs are calculated on a logarithmically binned grid with df/f = 0.15. Each PSD is the average of all n PSDs falling within the Γ1 ± 0.01 interval for the given Γ1 values. Black stars show PSDs in the 2.1–4.5 keV band, red triangles in the 4.5–5.7 keV band, blue circles in the 5.7–9.4 keV, and green squares in the 9.4–15 keV band. The gray line represents the PSD in the total 2.1–15 keV band. The increase in the 2.1–4.5 keV PSDs seen at highest frequencies (especially for Γ1 = 3.25) is not a source intrinsic effect, but is due to the high flux in this band and resulting telemetry overflow. |
| Open with DEXTER | |
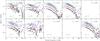 |
Fig. A.4
Overview of the average PSDs at different spectral shapes. PSDs are calculated on a logarithmically binned grid with df/f = 0.15. Each PSD is the average of all n PSDs falling within the Γ1 ± 0.01 interval for the given Γ1 values. Black stars show PSDs in the 2.1–4.5 keV band, red triangles in the 4.5–5.7 keV band, blue circles in the 5.7–9.4 keV, and green squares in the 9.4–15 keV band. The gray line represents the PSD in the total 2.1–15 keV band. |
| Open with DEXTER | |
© ESO, 2014
Current usage metrics show cumulative count of Article Views (full-text article views including HTML views, PDF and ePub downloads, according to the available data) and Abstracts Views on Vision4Press platform.
Data correspond to usage on the plateform after 2015. The current usage metrics is available 48-96 hours after online publication and is updated daily on week days.
Initial download of the metrics may take a while.