| Issue |
A&A
Volume 565, May 2014
|
|
|---|---|---|
| Article Number | A84 | |
| Number of page(s) | 13 | |
| Section | The Sun | |
| DOI | https://doi.org/10.1051/0004-6361/201322882 | |
| Published online | 15 May 2014 | |
Online material
Appendix A: Results from MBP2 and MBP3
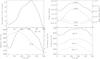 |
Fig. A.1
Simulated temporal evolution of plasma properties during the formation and disappearance of MBP2. Top left: normalised G-band intensity. Top right: evolution of total pressure (solid), gas pressure (dotted), magnetic pressure (dashed) and mass density (dash-dotted) at log(τ500 nm) = 0. Bottom left: evolution of modulus of the magnetic field (solid) and line-of-sight velocity (dashed) at log(τ500 nm) = 0, where downward (red-shifted) velocity is positive. Bottom right: plasma temperature evolution at log(τ500 nm) = 0 (solid), log(τ500 nm) = −1 (dashed) and log(τ500 nm) = −2 (dotted). Markers along the x-axis indicate times at which images and profiles were taken for Fig. A.2. |
| Open with DEXTER | |
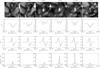 |
Fig. A.2
First row: sequence of simulated G-band images over time. The green box encloses the area where MBP2 is seen to appear and disappear. Second row: sequence of simulated Stokes-I profiles from the centre of MBP2 (solid) and these degraded to the SOT spatial resolution (dotted). Third row: sequence of Stokes-V profiles (solid) with these degraded to the SOT spatial resolution (dotted). Fourth row: sequence of Stokes |
| Open with DEXTER | |

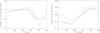 |
Fig. A.3
Left: the Stokes-V amplitude asymmetries emanating from the central pixel of MBP2 (solid) for the 6 profiles of Fig. A.2. Right: the corresponding Stokes-V area asymmetries. The asymmetries of the degraded profiles are also shown (dashed). |
| Open with DEXTER | |
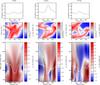 |
Fig. A.4
Top row: simulations of the normalised G-band intensity slices for three snapshots of the MBP before, during and after its peak intensity. Middle row: line-of-sight velocity maps of the solar surface with the centre of the MBP located at approximately (375, 375) km. Redshifted velocity is positive. The horizontal dashed line represents the cut at which the G-band intensity plots are taken for the top row graphs. Bottom row: vertical velocity maps perpendicular to the solar surface, taking into account vertical and horizontal velocities with arrows representing the direction and magnitude of velocities. The solid white line is used to show the location of optical depth unity. |
| Open with DEXTER | |
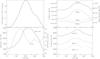 |
Fig. A.5
Simulated temporal evolution of plasma properties during the formation and disappearance of MBP3. Top left: normalised G-band intensity. Top right: evolution of total pressure (solid), gas pressure (dotted), magnetic pressure (dashed) and mass density (dash-dotted) at log(τ500 nm) = 0. Bottom left: evolution of modulus of the magnetic field (solid) and line-of-sight velocity (dashed) at log(τ500 nm) = 0, where downward (red-shifted) velocity is positive. Bottom right: plasma temperature evolution at log(τ500 nm) = 0 (solid), log(τ500 nm) = −1 (dashed) and log(τ500 nm) = −2 (dotted). Markers along the x-axis indicate times at which images and profiles were taken for Fig. A.6. |
| Open with DEXTER | |
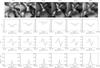 |
Fig. A.6
First row: sequence of simulated G-band images over time. The green box encloses the area where MBP3 is seen to appear and disappear. Second row: sequence of simulated Stokes-I profiles from the centre of MBP3 (solid) and these degraded to the SOT spatial resolution (dotted). Third row: sequence of Stokes-V profiles (solid) with these degraded to the SOT spatial resolution (dotted). Fourth row: sequence of Stokes |
| Open with DEXTER | |
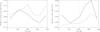 |
Fig. A.7
Left: the Stokes-V amplitude asymmetries emanating from the central pixel of MBP3 (solid) for the 6 profiles of Fig. A.6. Right: the corresponding Stokes-V area asymmetries. The asymmetries of the degraded profiles are also shown (dashed). |
| Open with DEXTER | |
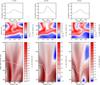 |
Fig. A.8
Top row: simulations of the normalised G-band intensity slices for three snapshots of the MBP before, during and after its peak intensity. Middle row: line-of-sight velocity maps of the solar surface with the centre of the MBP located at approximately (375, 375) km. Redshifted velocity is positive. The horizontal dashed line represents the cut at which the G-band intensity plots are taken for the top row graphs. Bottom row: vertical velocity maps perpendicular to the solar surface, taking into account vertical and horizontal velocities with arrows representing the direction and magnitude of velocities. The solid white line is used to show the location of optical depth unity. |
| Open with DEXTER | |
© ESO, 2014
Current usage metrics show cumulative count of Article Views (full-text article views including HTML views, PDF and ePub downloads, according to the available data) and Abstracts Views on Vision4Press platform.
Data correspond to usage on the plateform after 2015. The current usage metrics is available 48-96 hours after online publication and is updated daily on week days.
Initial download of the metrics may take a while.