Fig. A.8
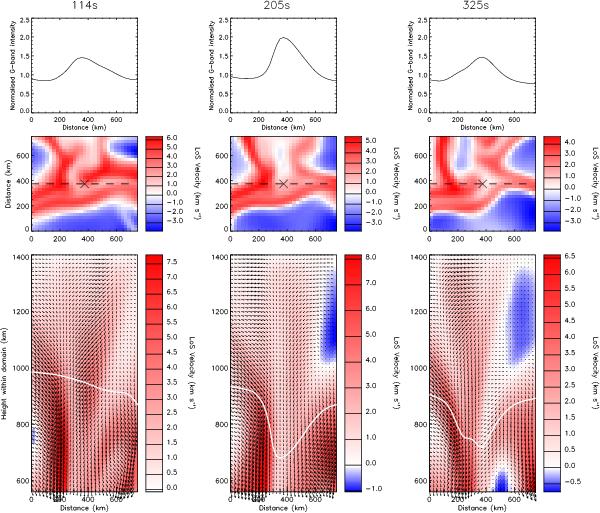
Top row: simulations of the normalised G-band intensity slices for three snapshots of the MBP before, during and after its peak intensity. Middle row: line-of-sight velocity maps of the solar surface with the centre of the MBP located at approximately (375, 375) km. Redshifted velocity is positive. The horizontal dashed line represents the cut at which the G-band intensity plots are taken for the top row graphs. Bottom row: vertical velocity maps perpendicular to the solar surface, taking into account vertical and horizontal velocities with arrows representing the direction and magnitude of velocities. The solid white line is used to show the location of optical depth unity.
Current usage metrics show cumulative count of Article Views (full-text article views including HTML views, PDF and ePub downloads, according to the available data) and Abstracts Views on Vision4Press platform.
Data correspond to usage on the plateform after 2015. The current usage metrics is available 48-96 hours after online publication and is updated daily on week days.
Initial download of the metrics may take a while.