Fig. A.1
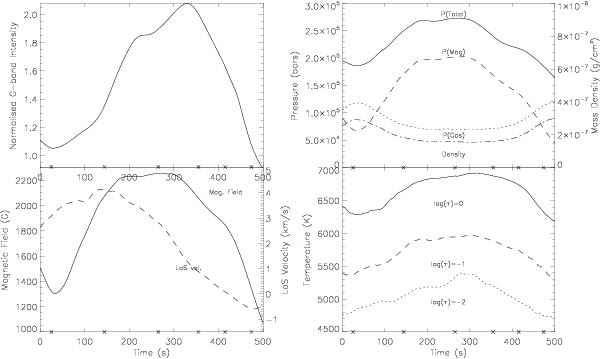
Simulated temporal evolution of plasma properties during the formation and disappearance of MBP2. Top left: normalised G-band intensity. Top right: evolution of total pressure (solid), gas pressure (dotted), magnetic pressure (dashed) and mass density (dash-dotted) at log(τ500 nm) = 0. Bottom left: evolution of modulus of the magnetic field (solid) and line-of-sight velocity (dashed) at log(τ500 nm) = 0, where downward (red-shifted) velocity is positive. Bottom right: plasma temperature evolution at log(τ500 nm) = 0 (solid), log(τ500 nm) = −1 (dashed) and log(τ500 nm) = −2 (dotted). Markers along the x-axis indicate times at which images and profiles were taken for Fig. A.2.
Current usage metrics show cumulative count of Article Views (full-text article views including HTML views, PDF and ePub downloads, according to the available data) and Abstracts Views on Vision4Press platform.
Data correspond to usage on the plateform after 2015. The current usage metrics is available 48-96 hours after online publication and is updated daily on week days.
Initial download of the metrics may take a while.