| Issue |
A&A
Volume 564, April 2014
|
|
|---|---|---|
| Article Number | L15 | |
| Number of page(s) | 6 | |
| Section | Letters | |
| DOI | https://doi.org/10.1051/0004-6361/201423435 | |
| Published online | 17 April 2014 | |
Online material
Appendix A
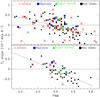 |
Fig. A.1
Tc slopes versus surface gravity of the stars from the full sample (top) and 58 solar analogs (bottom). Gray solid lines provide linear fits to the data points. |
| Open with DEXTER | |
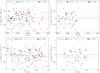 |
Fig. A.2
Tc slopes versus atmospheric parameters of the stars from the full sample (left) and solar analogs (right). |
| Open with DEXTER | |
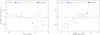 |
Fig. A.3
Tc slopes versus age and the mean of the apo- and pericentric distances for the solar twins in our sample. Gray solid lines provide linear fits to the data points. |
| Open with DEXTER | |
 |
Fig. A.4
Rmean versus age for the full sample. Red squares represent the stars with negative Tc slopes, and the stars with positive Tc slopes are marked by blue circles. Gray solid line provides linear fits to the full data points. |
| Open with DEXTER | |
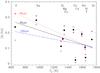 |
Fig. A.5
[X/Fe] versus Tc at three different galactocentric distances. The [X/Fe] values derived using the Galactic abundance gradients of Galactic Cepheids from Lemasle et al. (2008, 2013). The lines with different colors represent linear fits of the data. |
| Open with DEXTER | |
© ESO, 2014
Current usage metrics show cumulative count of Article Views (full-text article views including HTML views, PDF and ePub downloads, according to the available data) and Abstracts Views on Vision4Press platform.
Data correspond to usage on the plateform after 2015. The current usage metrics is available 48-96 hours after online publication and is updated daily on week days.
Initial download of the metrics may take a while.