Free Access
Fig. A.4
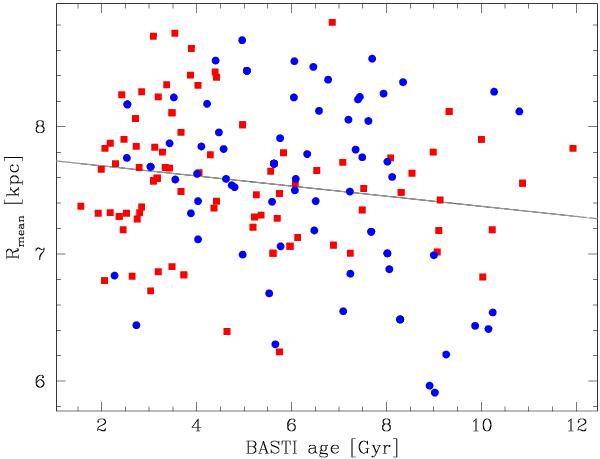
Rmean versus age for the full sample. Red squares represent the stars with negative Tc slopes, and the stars with positive Tc slopes are marked by blue circles. Gray solid line provides linear fits to the full data points.
Current usage metrics show cumulative count of Article Views (full-text article views including HTML views, PDF and ePub downloads, according to the available data) and Abstracts Views on Vision4Press platform.
Data correspond to usage on the plateform after 2015. The current usage metrics is available 48-96 hours after online publication and is updated daily on week days.
Initial download of the metrics may take a while.