| Issue |
A&A
Volume 564, April 2014
|
|
|---|---|---|
| Article Number | A39 | |
| Number of page(s) | 24 | |
| Section | Stellar structure and evolution | |
| DOI | https://doi.org/10.1051/0004-6361/201322798 | |
| Published online | 02 April 2014 | |
Online material
Appendix A: Tables
Tables A.1 and A.2 present the stellar parameters from our HHe analysis of the O Vz and O V samples. Table A.3 presents first estimates for the stars where it was also necessary to use nitrogen lines in the analysis due to weak He i lines and/or strong nebular contamination.
Stellar and wind parameters obtained from quantitative analysis of our sample of O Vz stars.
Stellar and wind parameters obtained from quantitative analysis of our sample of O V stars.
Appendix B: Figures
Figures B.1 to B.3 show the best-fitting models to the observed VFTS spectra for the most important diagnostic lines in this study, i.e., Hγ, He i λ4471, He ii 4541, He i 4686, and Hα.
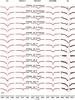 |
Fig. B.1
Observed spectra (black dots) and best-fitting synthetic models (red lines) of Hγ, He i λ4471, He ii λ4541, He ii λ4686 and Hα for the O Vz subsample. Each spectrum is labeled with its VFTS number and spectral classification. The cores of strong nebular lines have been removed. |
| Open with DEXTER | |
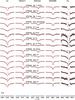 |
Fig. B.1
continued. |
| Open with DEXTER | |
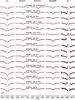 |
Fig. B.2
Observed spectra (black dots) and best-fitting synthetic models (red lines) for the O V subsample. |
| Open with DEXTER | |
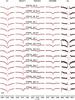 |
Fig. B.2
continued. |
| Open with DEXTER | |
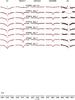 |
Fig. B.2
continued. |
| Open with DEXTER | |
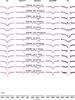 |
Fig. B.3
Observed spectra (black dots) and best-fitting synthetic models (pink lines) for the O Vz and O V stars analyzed using H, He and N as the diagnostic lines. |
| Open with DEXTER | |
© ESO, 2014
Current usage metrics show cumulative count of Article Views (full-text article views including HTML views, PDF and ePub downloads, according to the available data) and Abstracts Views on Vision4Press platform.
Data correspond to usage on the plateform after 2015. The current usage metrics is available 48-96 hours after online publication and is updated daily on week days.
Initial download of the metrics may take a while.