| Issue |
A&A
Volume 564, April 2014
|
|
|---|---|---|
| Article Number | A6 | |
| Number of page(s) | 12 | |
| Section | Planets and planetary systems | |
| DOI | https://doi.org/10.1051/0004-6361/201321804 | |
| Published online | 27 March 2014 | |
Online material
Appendix A: Additional figures
In this appendix, we present figures that show the dependence of measured eclipse depth on the choice of aperture radii and on the choice of different reference star combinations. We also display the correlations between raw light-curve flux and detrending parameters.
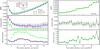 |
Fig. A.1
Dependence of rms, measured eclipse depth, and red noise factor on aperture size and reference ensemble for the K band. The left panel shows the dependence on aperture size. The top subpanel displays the rms of light-curve O–C residuals. The middle subpanel displays corresponding eclipse depths. The bottom subpanel displays the time-averaging red noise factor (i.e. β2 as denoted in Sect. 3). The results derived from three cases of baseline functions (BF) are shown for comparison: the chosen best BF, a candidate BF that results in similar BIC to the best BF, and a linear BF that produces a poor fit. The vertical dotted line refers to the chosen aperture size, while the dash-shaded area refers to the 1σ confidence level of our reported result. The right panel shows the dependence of rms, measured eclipse depth, and red noise factor on different reference star ensembles. These ensembles have been sorted according to rms for display purposes, with the best one being #1. The subpanels on the right are organized in the same manner as for the left. |
| Open with DEXTER | |
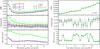 |
Fig. A.2
Dependence of rms, measured eclipse depth, and red noise factor on aperture size and reference ensemble for the J band. The subpanels in this figure are organized in the same manner as Fig. A.1. |
| Open with DEXTER | |
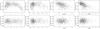 |
Fig. A.3
Correlation between instrumental parameters (i.e. variables in the baseline function) and the normalized flux for the K band. The first row shows the flux before baseline correction, while the second row shows the flux after baseline correction as a comparison. In these plots, x and y refer to the relative positions, and FWHMx and FHWMy refer to the full-width at half maximum of the marginalized PSF, both in pixels. |
| Open with DEXTER | |
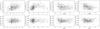 |
Fig. A.4
Correlation between instrumental parameters and the normalized flux for the J band. The figure is displayed in the same manner as Fig. A.3. |
| Open with DEXTER | |
© ESO, 2014
Current usage metrics show cumulative count of Article Views (full-text article views including HTML views, PDF and ePub downloads, according to the available data) and Abstracts Views on Vision4Press platform.
Data correspond to usage on the plateform after 2015. The current usage metrics is available 48-96 hours after online publication and is updated daily on week days.
Initial download of the metrics may take a while.