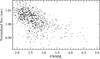
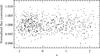
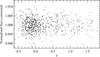
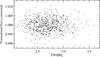
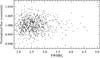
Fig. A.3
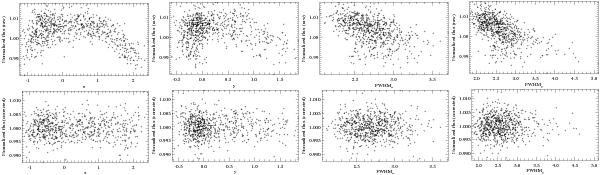
Correlation between instrumental parameters (i.e. variables in the baseline function) and the normalized flux for the K band. The first row shows the flux before baseline correction, while the second row shows the flux after baseline correction as a comparison. In these plots, x and y refer to the relative positions, and FWHMx and FHWMy refer to the full-width at half maximum of the marginalized PSF, both in pixels.
Current usage metrics show cumulative count of Article Views (full-text article views including HTML views, PDF and ePub downloads, according to the available data) and Abstracts Views on Vision4Press platform.
Data correspond to usage on the plateform after 2015. The current usage metrics is available 48-96 hours after online publication and is updated daily on week days.
Initial download of the metrics may take a while.