| Issue |
A&A
Volume 562, February 2014
|
|
|---|---|---|
| Article Number | A30 | |
| Number of page(s) | 28 | |
| Section | Extragalactic astronomy | |
| DOI | https://doi.org/10.1051/0004-6361/201322835 | |
| Published online | 03 February 2014 | |
Online material
Appendix A: Statistics on the z–Mstar–SFR grid
We report in Tables A.1 the number of sources in each z–Mstar–SFR bin and the associated average dust mass.
Number of sources (upper number in each cell) and average dust mass (lower number in each cell) in each z–Mstar–SFR bin.
Appendix B: Reliability of the SFR estimates
To verify the reliability of the 24 μm-based SFR tracer (SFR24), we compare it with the SFR measured by fitting the average FIR stacked flux densities (SFRFIR). We fit these flux densities with the Dale & Helou (2002) IR template library to infer an estimate of the total IR luminosity, and account for the unobscured SFR by taking into account the average rest-frame UV luminosity in the bin uncorrected for extinction (see Sect. 3.2 for more details). The same results are found if the MS template of Elbaz et al. (2011) is used instead of the Dale & Helou (2002) library. In the left panel of Fig. B.1 we compare the average SFR24 in each bin of the grid with the average SFRFIR. The two SFR measurements nicely agree with each other with the only noticeable exception of the lowest redshift bin, making us confident of the method adopted. The small offset observed at low-z does not significantly affect our results.
We also repeated the same test by making use of a “ladder of SFR indicators” (SFRladder, e.g. Wuyts et al. 2011a) as input for the grid production. Such a “ladder” approach combines different SFR estimates by using the best available choice for each galaxy. More specifically, a Herschel-based SFR is used for galaxies detected by PACS or SPIRE, the 24 μm-based tracer
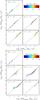 |
Fig. B.1
Left: comparison between the 24 μm-based SFR used in the analysis (x-axis) and the SFR measured by fitting the average FIR stacked flux densities for each bin of the grid (y-axis). The colour code indicates the mean stellar mass in each bin. Right: same as the left panel, but FIR-based SFR are compared to the SFR measured by means of a “ladder” approach (see text). |
| Open with DEXTER | |
is adopted for galaxies undetected by Herschel but detected by MIPS, and the output of the optical-UV SED fitting described in Sect. 3.1 is used for galaxies undetected at IR wavelengths. Most importantly, this approach has the advantage of increasing the number of galaxies for which a SFR estimate is available and enlarging the SFR dynamical range. However, as evident from the right panel of Fig. B.1, the scatter with respect to SFRFIR is larger than in the previous case. Moreover, the correlation between SFRladder and SFRFIR flattens at low SFR and z > 0.2, exactly at the SFR regime where in principle the “ladder” approach provides an improvement over the 24 μm-based SFR. One possibility to explain the flat behaviour at low SFR (below a redshift-dependent threshold) shown in the right panel of Fig. B.1 is to ascribe it to failures in the associations of optical counterparts for the extremely faint IR galaxies or blending issues mostly affecting the faintest galaxies during the stacking procedure. Alternatively, dust heating by old stellar population might also be responsible for the enhanced IR flux at low SFR. However, investigating the reasons of such disagreement is beyond the scope of the present work. Based on the tests performed, we decide to use SFR24 as a SFR tracer, at the expenses of reducing the SFR dynamical range, in order not to run the risk to introduce systematics in the analysis.
Appendix C: Simulation to test against possible degeneracies in the SFR–Mdust correlation
We run a simulation to verify that the trend observed between the SFR and the dust mass (Fig. 2) is real and not a trivial outcome of the fact that both physical variables are related to the FIR peak of the galaxy SED. Indeed, while the SFR is simply proportional to the integrated light in the dust emission peak, the dust mass depends not only on the normalization of the spectrum but also on the temperature of the grains, which determines its shape.
The aim of the simulation is to verify whether an initially scattered and uncorrelated distribution of mock SFR and Mdust gives rise to a correlation when the two quantities are recomputed according to our methods. To do that, we consider a set of GRASIL templates, each associated to a dust mass (Mdust INPUT) and to a SFR (SFRINPUT). The latter is computed by integrating the template from 8 and 1000 μm and multiplying by the calibration factor 1.8 × 10⁻¹⁰ (see Sect. 3.2). In order to sample a wide region of the SFR–Mdust parameter space, we multiply each SFR–Mdust pair by a normalization factor. This corresponds to multiplying the associated SED, since both parameters scale with the SED normalization. We consider a range in SFR and Mdust which mimic that observed in one of the redshift interval most populated by our data, i.e., 0.6 < z < 1. The resulting SFR–Mdust distribution is shown in the left panel of Fig. C.1.
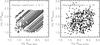 |
Fig. C.1
Distribution of mock SFR and Mdust in input (left panel) and output (right panel) of the simulation described in text. The measure of the SFR and Mdust does not introduce a correlation in an initially uncorrelated distribution. The value of the Pearson coefficient is printed in both cases. |
| Open with DEXTER | |
We redshift each mock galaxy to a random redshift within the 0.6-1 interval, and interpolate the associated spectrum with the MIPS 24 μm and Herschel 100–500 μm filters. To mimic the real case, we perturb such mock flux densities by adding a noise randomly extracted from the observed noise distribution in each band. We then measure the SFR (SFROUTPUT) and Mdust (Mdust OUTPUT) for each mock galaxy exactly as we have done for the real data. Consistently with what described in Sect. 3.5, we reject sources not compliant with our requirements to ensure reliable dust mass estimates. The resulting measurements are shown in the right panel of Fig. C.1 and show no evidence for any correlation between SFR and Mdust. The absence of any correlation induced by our measures is statistically confirmed by the values of the Pearson coefficients on the input (0.11) and output (0.19) data point distributions. This simulation illustrates that the correlations between Mdust and SFR is not an artefact of the method, but is physical (i.e., the result of the S-K law).
Appendix D: Fits of the FIR SEDs
In Fig. D.1 we report the best fits of Herschel stacked flux densities with Draine & Li (2007) templates computed to estimate the dust mass. The secondary bump around 50 μm which can be seen in few of the best-fit SEDs is due to a warm dust component. This feature gradually disappears when the maximum radiation intensity (Umax) in the Draine & Li (2007) model is set to lower values. However, fixing Umax to a value lower than 106 has the overall effect of making each template slightly warmer and lowering the normalization of the Rayleigh-Jeans side of the spectrum. This has the effect of increasing the inferred dust masses by a factor of 1.5–2, due to a larger normalization of the SED for a given set of observed flux densities. We decide to follow the prescription given by Draine et al. (2007) and fixing Umax to 106. However, we note that an offset would not change our main results.
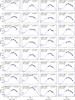 |
Fig. D.1
Far-IR SED fits of the Herschel stacked flux densities with Draine & Li (2007) templates. Each panel refers to a bin of the z–Mstar–SFR grid. The average value of redshift, stellar mass and SFR for galaxies belonging to each bin is printed in each panel. |
| Open with DEXTER | |
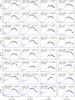 |
Fig. D.1
continued. |
| Open with DEXTER | |
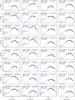 |
Fig. D.1
continued. |
| Open with DEXTER | |
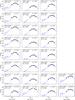 |
Fig. D.1
continued. |
| Open with DEXTER | |
© ESO, 2014
Current usage metrics show cumulative count of Article Views (full-text article views including HTML views, PDF and ePub downloads, according to the available data) and Abstracts Views on Vision4Press platform.
Data correspond to usage on the plateform after 2015. The current usage metrics is available 48-96 hours after online publication and is updated daily on week days.
Initial download of the metrics may take a while.