| Issue |
A&A
Volume 560, December 2013
|
|
|---|---|---|
| Article Number | A103 | |
| Number of page(s) | 16 | |
| Section | Interstellar and circumstellar matter | |
| DOI | https://doi.org/10.1051/0004-6361/201322537 | |
| Published online | 13 December 2013 | |
Online material
Appendix A: VLA1623W
In our ALMA observations, we detect VLA1623W in continuum (see Sect. 3.1 and Fig. 1) and in C18O line emission (Fig. A.1), which was previously undetected with SMA observations. The emission is weak, peaking at 5σ in the channel maps and at 13σ in the intensity integrated map, and it has a velocity range of about − 0.5 to 1 km s-1. Noteworthy is VLA1623W’s apparent systemic velocity vlsr between 0 and 1 km s-1, which differs from VLA1623A’s systemic velocity by 3 to 4 km s-1. VLA1623W’s vlsr is difficult to determine with certainty since the emission appears to be strongly affected by foreground material (see Sect. 3.2) and the low S/N of the detection. Finally, no C18O emission was detected towards VLA1623B (Fig. 1, top left inset), which is consistent with previous CO depletion findings (Murillo & Lai 2013).
The velocity gradient of VLA1623W’s C18O emission appears to be consistent with a rotationally supported disk structure, and given that VLA1623W is classified as a Class I source (Murillo & Lai 2013), this is very likely. However, since the emission is very close to the edge of the field of view (Fig. 1) and is affected by foreground absorption, we are limited in carrying out kinematical analysis of the emission.
Finally the large difference in systemic velocity from VLA1623A and B may suggest one of two scenarios. First, VLA1623W is not part of the system, but is instead a foreground or nearby source, that due to projection effects seems to be part of the system. However, Dzib et al. (2013) rule out the possibility of VLA1623W (or VLA1623B) being a foreground or background object due to its proper motion. Second, due to three-body interaction, VLA1623W was ejected from the closer binary of VLA1623A and B (Reipurth 2000). This possibility is very likely, given that VLA1623B may be a very recent formation, which would have caused the binary, now triple, to become unstable and eject one of the components. This ejection would cause VLA1623W to lose some of its envelope mass and appear more evolved, since one of the classification criteria is the envelope to central star mass ratio. The loss of mass would also make it more visible in the infrared and affect its evolution.
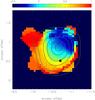 |
Fig. A.1
Integrated intensity (moment 0, contours) and velocity (moment 1, halftone) maps of C18O (2−1) detection towards VLA1623W. The position of VLA1623W is marked with a black square. Contours are in steps of 3σ, 5σ, 8σ,10σ, 12σ, and 13σ with σ = 13 mJy beam-1. |
| Open with DEXTER | |
Appendix B: Comparison of thin disk models and observations
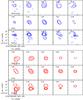 |
Fig. B.1
Channel maps of C18O observations (top), free falling disk model shown in Fig. 6 (middle) and residual (bottom panel). The blue contours show the blueshifted emission and the red contours the redshifted emission. Number labels on the top of each panel indicate the velocity of that channel. Channels are binned to a velocity resolution of 0.16 km s-1 for the blueshifted emission, and 0.33 km s-1 for the redshifted emission for better display. Contours are in steps of 3σ, 5σ, 10σ, 15σ, 20σ and 25σ for the observations and model channel maps, and − 8σ, − 5σ, − 3σ, 3σ, 4σ, 5σ and 6σ for the residual channel map, where σ = 19 mJy beam-1. |
| Open with DEXTER | |
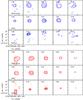 |
Fig. B.2
Same as Fig. B.1 but for the free fall plus Keplerian disk model shown in Fig. 6. |
| Open with DEXTER | |
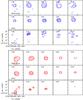 |
Fig. B.3
Same as Fig. B.1 but for the Conserved Angular Momentum disk model shown in Fig. 6. Note the large negative residuals in the blueshifted emission. |
| Open with DEXTER | |
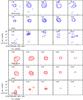 |
Fig. B.4
Same as Fig. B.1 but for the Infall plus Keplerian disk model shown in Fig. 6. |
| Open with DEXTER | |
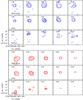 |
Fig. B.5
Same as Fig. B.1 but for the best fit pure Keplerian disk model shown in Fig. 6. |
| Open with DEXTER | |
In this appendix, we present the channel map comparison for each model and observations, as well as the residual obtained from subtracting the model from the observations. The figures presented below are a supplement to Fig. 6 in order to gauge the best-fitting model of the observed emission. All figures below show the blueshifted emission in the velocity range of 2.3 to 3 km s-1, while the redshifted emission is in the velocity range of 4.8 to 6.5 km s-1.
© ESO, 2013
Current usage metrics show cumulative count of Article Views (full-text article views including HTML views, PDF and ePub downloads, according to the available data) and Abstracts Views on Vision4Press platform.
Data correspond to usage on the plateform after 2015. The current usage metrics is available 48-96 hours after online publication and is updated daily on week days.
Initial download of the metrics may take a while.