Fig. B.1
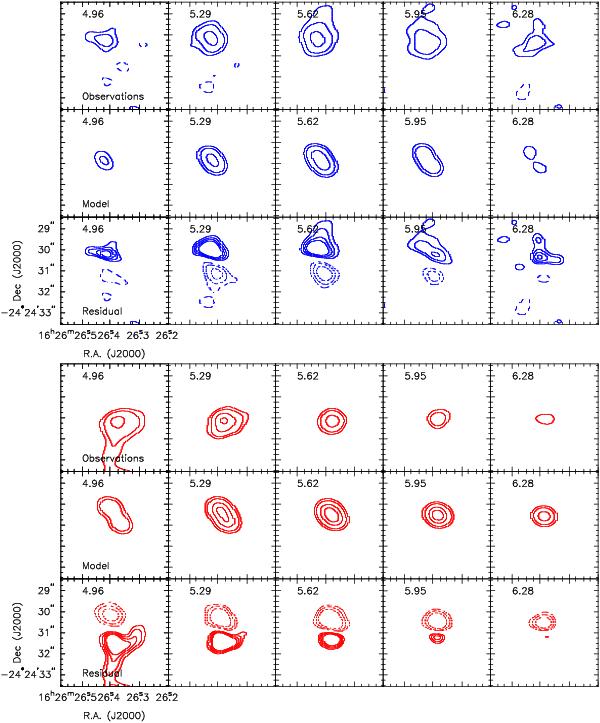
Channel maps of C18O observations (top), free falling disk model shown in Fig. 6 (middle) and residual (bottom panel). The blue contours show the blueshifted emission and the red contours the redshifted emission. Number labels on the top of each panel indicate the velocity of that channel. Channels are binned to a velocity resolution of 0.16 km s-1 for the blueshifted emission, and 0.33 km s-1 for the redshifted emission for better display. Contours are in steps of 3σ, 5σ, 10σ, 15σ, 20σ and 25σ for the observations and model channel maps, and − 8σ, − 5σ, − 3σ, 3σ, 4σ, 5σ and 6σ for the residual channel map, where σ = 19 mJy beam-1.
Current usage metrics show cumulative count of Article Views (full-text article views including HTML views, PDF and ePub downloads, according to the available data) and Abstracts Views on Vision4Press platform.
Data correspond to usage on the plateform after 2015. The current usage metrics is available 48-96 hours after online publication and is updated daily on week days.
Initial download of the metrics may take a while.