| Issue |
A&A
Volume 559, November 2013
|
|
|---|---|---|
| Article Number | A66 | |
| Number of page(s) | 13 | |
| Section | Stellar structure and evolution | |
| DOI | https://doi.org/10.1051/0004-6361/201322420 | |
| Published online | 15 November 2013 | |
Online material
Appendix A: Constraining CE ejection efficiency
Our choice of the CE ejection efficiency parameter αCE is
based on the following population synthesis estimate for the Galactic nova rate (per
year) which is constrained by observations (Shafter
2002). In the population synthesis algorithm for counting novae, the total
frequency (νtot) of nova-explosions (per year) for
Z = 0.02 and a constant star formation rate,
S = 7.086 yr-1 (following the prescription of Hurley et al. 2002), is estimated from,  (A.1)with the nova recurrence time
 for a binary system calculated for every
timestep δtnova of its evolution in a nova-phase from,
for a binary system calculated for every
timestep δtnova of its evolution in a nova-phase from,
 (A.2)using the expression of Yungelson et al. (1995) for the critical ignition
mass
(A.2)using the expression of Yungelson et al. (1995) for the critical ignition
mass  ,
,
 (A.3)The WD radius
RWD is determined according to the formula of Nauenberg (1972),
(A.3)The WD radius
RWD is determined according to the formula of Nauenberg (1972),
 (A.4)where
MCh = 1.43 M⊙ is the Chandrasekhar mass.
(A.4)where
MCh = 1.43 M⊙ is the Chandrasekhar mass.
Appendix A.1: Galactic nova rate
With the above prescription, the total rate of novae in the Galaxy
(Z = 0.02) is calculated using binary_c/nucsyn as,
 (A.5)assuming a constant binary fraction
fbin = 0.5 (Duquennoy
& Mayor 1991). As shown in Table A.1, our estimate of the Galactic nova rate is consistent with existing
estimates of 30 ± 10 yr-1 (Shafter
2002) within a factor of ~2–3, being closer to the observed rate for
values of αCE < 0.5, and decreasing with higher values
of αCE.
(A.5)assuming a constant binary fraction
fbin = 0.5 (Duquennoy
& Mayor 1991). As shown in Table A.1, our estimate of the Galactic nova rate is consistent with existing
estimates of 30 ± 10 yr-1 (Shafter
2002) within a factor of ~2–3, being closer to the observed rate for
values of αCE < 0.5, and decreasing with higher values
of αCE.
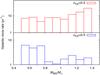 |
Fig. A.1
Histograms of predicted Galactic nova rate as function of WD mass, MWD per 0.1 M⊙ bin, for αCE = 0.2 (upper panel) and 0.5 (lower panel). The total rate of novae in the Galaxy Rnova is the sum of the contributions from all MWD bins. |
| Open with DEXTER | |
Figure A.1 further illustrates the sensitivity of the nova rate to the choice of αCE. The nova rate decreases sharply at higher WD masses and for more efficient CE ejection. This is expected because the final separation after the CE phase increases with αCE, so that for a higher αCE, the post-CE binary is too wide for the secondary to evolve to fill its Roche lobe. Because of shorter recurrence times for massive WDs which lead to more frequent outbursts, the total nova rate drops sharply with increasing αCE (0.2to0.5). Nelson et al. (2004) also find an increase in the nova rate by a factor of ~2–3 for lower CE ejection efficiency. For αCE < 0.2, the nova rate decreases as more systems merge following the CE phase that leads to the WD-MS binary.
Appendix A.2: Additional tests for nova binaries
The fraction, α, of binary systems hosting WDs that lead to novae is
also estimated as,  (A.6)where
 is the birth rate of WDs in binary
systems. Also, the frequency averaged WD mass (⟨MWD⟩ in
M⊙) is calculated for different choices of
αCE (<1). As shown in Table A.1, our estimates for this fraction α (defined by
Eq. (A.6)) is close to the value of
0.02 used by Romano & Matteucci (2005) to
match the observed nucleosynthesis yields for Galactic novae. The averaged (by nova
frequency) WD mass ⟨MWD⟩ is also in agreement with the
values in the range of 0.8−1.1 M⊙ as obtained by Nelson et al. (2004).
is the birth rate of WDs in binary
systems. Also, the frequency averaged WD mass (⟨MWD⟩ in
M⊙) is calculated for different choices of
αCE (<1). As shown in Table A.1, our estimates for this fraction α (defined by
Eq. (A.6)) is close to the value of
0.02 used by Romano & Matteucci (2005) to
match the observed nucleosynthesis yields for Galactic novae. The averaged (by nova
frequency) WD mass ⟨MWD⟩ is also in agreement with the
values in the range of 0.8−1.1 M⊙ as obtained by Nelson et al. (2004).
Appendix B: HBB J-stars: single stars vs. binary mergers
If mass ratio q exceeds a critical value
qcrit (as defined in Hurley et al. 2002), RLOF from a GB star to a lower mass MS companion is
dynamically unstable and mass transfer leads to a CE phase in which the system can merge
depending on the initial separation. For such a Case-B RLOF merger, the MS star is
absorbed into the envelope and the core-mass of the merger is determined by the core of
the GB donor star at the onset of the CE phase. Consequently, following the CE phase,
the merged star has a lower core mass on the GB compared to a single star of same total
mass. Because the core mass at the base of the AGB phase in our synthetic models depends
on the core mass at the base of the GB (Hurley et al.
2002), such mergers ascend the AGB with lower core masses than single AGB stars
of similar total masses. Consequently they live longer on the AGB and, for total masses
higher than about 4 M⊙ for which HBB occurs along with
TDU, we predict such mergers also behave as J-stars for a longer phase on the AGB as
compared to single HBB AGB stars. Figure B.1 shows
an example of the J-star phase for such a binary merger that lasts for about 1 Myr
compared to the much shorter span of about 0.1 Myr for an equivalent single star. The
binary system initially consists of a 3.1 M⊙ primary star
which overflows its Roche lobe on the GB with a core mass of
0.45 M⊙ that subsequently forms the core of the merged
star following a CE phase with the 1.3 M⊙ (MS) secondary
absorbed into the giant envelope. Thus, the merger core (and envelope) mass is
significantly different from a single star of similar total mass, and consequently the
core mass can only grow to 0.47 M⊙ at the end of the GB –
significantly lower than the expected core mass
(~0.73 M⊙) of a corresponding single star. This in
turn leads to a lower core mass at the start of the TPAGB for the binary merger and
consequently it evolves for a longer phase with TDU because of which its surface C/O
exceeds 1, and HBB that decreases the isotopic ratios of
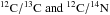 on the stellar surface classifying it as
a J-star.
on the stellar surface classifying it as
a J-star.
 |
Fig. B.1
Evolutionary properties on the TPAGB for a single star (upper
panel) and a GB-MS (Case-B RLOF) binary merger (lower
panel) of similar total mass. The core mass
Mc and surface C/O are plotted on the left scale,
along with surface isotopic ratios, |
| Open with DEXTER | |

© ESO, 2013
Current usage metrics show cumulative count of Article Views (full-text article views including HTML views, PDF and ePub downloads, according to the available data) and Abstracts Views on Vision4Press platform.
Data correspond to usage on the plateform after 2015. The current usage metrics is available 48-96 hours after online publication and is updated daily on week days.
Initial download of the metrics may take a while.