Fig. B.1
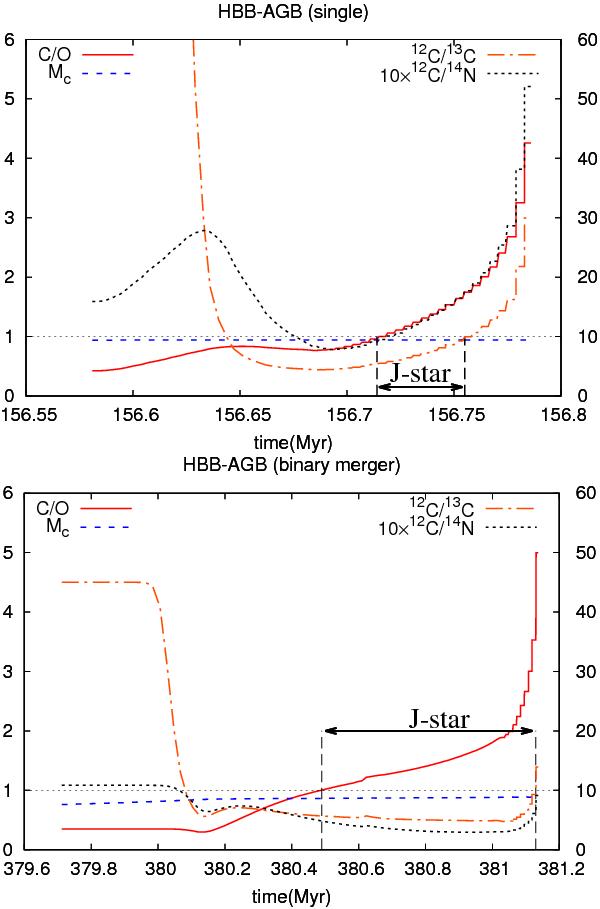
Evolutionary properties on the TPAGB for a single star (upper
panel) and a GB-MS (Case-B RLOF) binary merger (lower
panel) of similar total mass. The core mass
Mc and surface C/O are plotted on the left scale,
along with surface isotopic ratios,  (multiplied by a factor of 10) on
the right scale. The dotted horizontal lines mark C/O = 1 and
(multiplied by a factor of 10) on
the right scale. The dotted horizontal lines mark C/O = 1 and
 while the dashed vertical lines
mark the duration of the J-star phase.
while the dashed vertical lines
mark the duration of the J-star phase.
Current usage metrics show cumulative count of Article Views (full-text article views including HTML views, PDF and ePub downloads, according to the available data) and Abstracts Views on Vision4Press platform.
Data correspond to usage on the plateform after 2015. The current usage metrics is available 48-96 hours after online publication and is updated daily on week days.
Initial download of the metrics may take a while.