| Issue |
A&A
Volume 559, November 2013
|
|
|---|---|---|
| Article Number | A12 | |
| Number of page(s) | 14 | |
| Section | Stellar structure and evolution | |
| DOI | https://doi.org/10.1051/0004-6361/201221012 | |
| Published online | 29 October 2013 | |
Online material
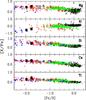 |
Fig. 3
Abundance ratios [X/Fe] for aluminum and α-elements versus [Fe/H]. The data were taken from Luck & Heiter (2007) (black crosses); Reddy et al. (2006) (green crosses); Fulbright (2000) (red crosses); Gratton & Sneden (1991), and For & Sneden (2011) (blue crosses). CD-41°15048 and HD 214362 are represented by black squares. |
| Open with DEXTER | |
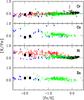 |
Fig. 4
Abundance ratios [X/Fe] for the iron group elements versus [Fe/H]. Symbols have the same meaning as in Fig. 3. |
| Open with DEXTER | |
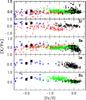 |
Fig. 5
Abundance ratios [X/Fe] for the heavy elements. Symbols have the same meaning as in Fig. 3, except for zirconium and lanthanum. For zirconium we used the results of Edvardsson et al. (1993) (black crosses), and for lanthanum we used the results of Mishenina et al. (2006) (black crosses). |
| Open with DEXTER | |
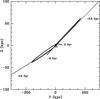 |
Fig. 8
Same as in Fig. 7, but in the YZ plane. |
| Open with DEXTER | |
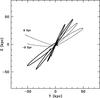 |
Fig. 10
Same as in Fig. 9, but in the YZ plane. |
| Open with DEXTER | |
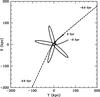 |
Fig. 11
Same as in Fig. 7, but for BD+09°3223 in the XY plane. The present position is labeled with “X”. |
| Open with DEXTER | |
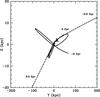 |
Fig. 12
Same as in Fig. 11, but in the YZ plane. |
| Open with DEXTER | |
Observed Fe i and Fe ii lines.
Other lines studied.
Abundance uncertainties for CD-41°15048.
© ESO, 2013
Current usage metrics show cumulative count of Article Views (full-text article views including HTML views, PDF and ePub downloads, according to the available data) and Abstracts Views on Vision4Press platform.
Data correspond to usage on the plateform after 2015. The current usage metrics is available 48-96 hours after online publication and is updated daily on week days.
Initial download of the metrics may take a while.