Free Access
Fig. 3
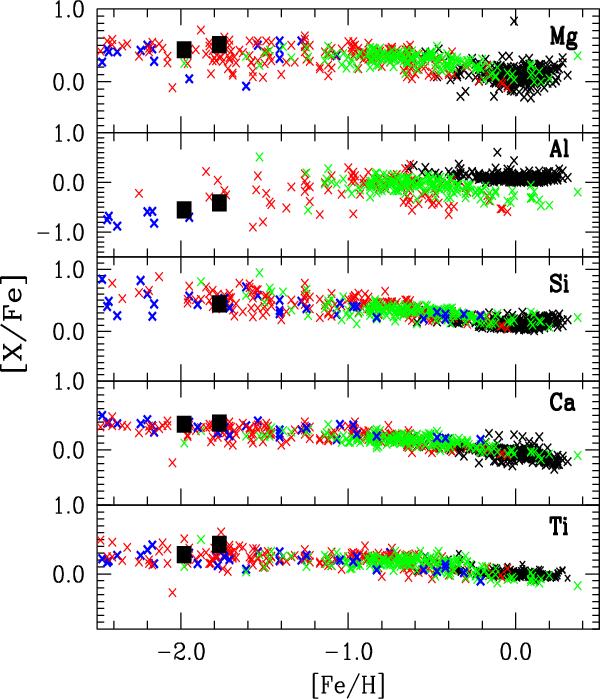
Abundance ratios [X/Fe] for aluminum and α-elements versus [Fe/H]. The data were taken from Luck & Heiter (2007) (black crosses); Reddy et al. (2006) (green crosses); Fulbright (2000) (red crosses); Gratton & Sneden (1991), and For & Sneden (2011) (blue crosses). CD-41°15048 and HD 214362 are represented by black squares.
Current usage metrics show cumulative count of Article Views (full-text article views including HTML views, PDF and ePub downloads, according to the available data) and Abstracts Views on Vision4Press platform.
Data correspond to usage on the plateform after 2015. The current usage metrics is available 48-96 hours after online publication and is updated daily on week days.
Initial download of the metrics may take a while.