| Issue |
A&A
Volume 558, October 2013
|
|
|---|---|---|
| Article Number | A143 | |
| Number of page(s) | 24 | |
| Section | Extragalactic astronomy | |
| DOI | https://doi.org/10.1051/0004-6361/201322276 | |
| Published online | 23 October 2013 | |
Online material
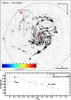 |
Fig. 4
(Top panel) Continuum-subtracted Hα image of M 101, obtained from http://www.aoc.nrao.edu. The 25th B-band magnitude elliptic contour is shown by a black solid line, along with the position of SN 1909A (marked by a red star) and the center of the galaxy (marked by a red circle). We also show the field of view (FOV) of ALFOSC and the slit position. The width of the slit (1″) has been enhanced in the figure to show, through a color code, the measured metallicity at the position of a bright H ii region that we inspected. (Bottom panel) Metallicity gradient of M 101 from Kennicutt et al. (2003). In the plot we include our measurement, which matches with those that are already published. The linear fit from Kennicutt et al. (2003) is shown by a dashed line. The interpolated metallicity at the SN distance is marked by a red square and its uncertainty corresponds to the fit error. The error bar (±0.2 dex) for our N2 measurement is shown aside. The positions of SN and nucleus are marked by vertical dotted lines. The solar metallicity (Asplund et al. 2009) and the LMC metallicity (Russell & Dopita 1990) are indicated by two horizontal dotted lines. |
| Open with DEXTER | |
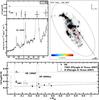 |
Fig. 5
(Top-right panel) Continuum-subtracted Hα image of NGC 4490. The 25th B-band magnitude elliptic contour is shown by a black solid line, along with the positions of SN 1982F (marked by a red star), SN 2008ax (marked by a red diamond) and the center of the galaxy (marked by a red circle). The slit position is shown, and a color code is used to present the N2 metallicity measurements at the position of each H ii region that we inspected. The slit width (1′′) has been enhanced to better show the colored patches. (Top-left panel) Flux at the Hα wavelength along the slit, shown as a function of the distance from the location of SN 1982F (marked by a dashed line). The N2 measurements are shown at the corresponding positions in the upper sub-panel. (Bottom panel) Metallicity gradient of NGC 4490. In the plot we include the measurements from Pilyugin & Thuan (2007), which match our N2 metallicity estimates. The linear fit on our measurements is shown by a solid line. The interpolated metallicity at the distance of SN 1982F is marked by a red square and its uncertainty corresponds to the fit error. The error bar (±0.2 dex) for our N2 measurements is shown aside. The positions of SN 1982F, SN 2008ax and nucleus are marked by vertical dotted lines. The solar metallicity (Asplund et al. 2009) and the LMC metallicity (Russell & Dopita 1990) are indicated by two horizontal dotted lines. |
| Open with DEXTER | |
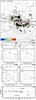 |
Fig. 6
(Top panel) Continuum-subtracted Hα image of IC 2627. The 25th B-band magnitude elliptic contour is shown by a black solid line, along with the position of SN 1998A (marked by a red star), the center of the galaxy (marked by a red circle) and the position of SN 1994R (marked by a red diamond). The positions of the four slits are shown, and a color code is used to present the N2 metallicity measurements at the position of each H ii region that we inspected. (Center panels) Flux at the Hα wavelength along the four slits, shown as a function of the distance from the SN location. These positions are marked by dotted lines. The N2 measurements for each H ii region are shown at the corresponding positions in the upper sub-panels. (Bottom panel) Metallicity gradient of IC 2627. The linear fit on our measurements is shown by a solid line. The interpolated metallicity at the SN distance is marked by a red square and its uncertainty corresponds to the fit error. The error bar (±0.2 dex) for our N2 measurements is shown aside. The positions of SN and nucleus are marked by vertical dotted lines. The solar metallicity (Asplund et al. 2009) and the LMC metallicity (Russell & Dopita 1990) are indicated by two horizontal dotted lines. |
| Open with DEXTER | |
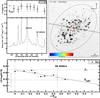 |
Fig. 7
(Top-right panel) Continuum-subtracted Hα image of IC 1158. The 25th B-band magnitude elliptic contour is shown by a black solid line, along with the position of SN 2000cb (marked by a red star) and the center of the galaxy (marked by a red circle). The slit position is shown, and a color code is used to present the N2 metallicity measurements at the position of each H ii region that we inspected. (Top-left panel) Flux at the Hα wavelength along the slit, shown as a function of the distance from the SN location (marked by a dotted line, like the nucleus position). The N2 measurements are shown at the corresponding positions in the top sub-panel. (Bottom panel) Metallicity gradient IC 1158, see the bottom-panel caption of Fig. 6 for details. |
| Open with DEXTER | |
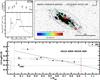 |
Fig. 8
(Top-right panel) Continuum-subtracted Hα image of 2MASX J05553978-6855381, see the top-right panel caption of Fig. 7 for details. (Top-left panel) Flux at the Hα wavelength along the slit, see the top-left panel caption of Fig. 7 for details. (Bottom panel) Metallicity gradient of 2MASX J05553978-6855381, see the bottom-panel caption of Fig. 6 for details. |
| Open with DEXTER | |
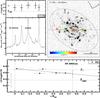 |
Fig. 9
(Top-right panel) Continuum-subtracted Hα image of IC 1303, see the top-right panel caption of Fig. 7 for details. (Top-left panel) Flux at the Hα wavelength along the slit, see the top-left panel caption of Fig. 7 for details. (Bottom panel) Metallicity gradient of IC 1303, see the bottom-panel caption of Fig. 6 for details. |
| Open with DEXTER | |
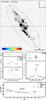 |
Fig. 10
(Top panel) Continuum-subtracted Hα image of NGC 5682, see the top-right panel caption of Fig. 7 for details. Here we show the positions of two slits. (Center panels) Flux at the Hα wavelength along the two slits, shown as a function of the distance from the SN location and from the nucleus. These positions are marked by vertical dotted lines. The N2 measurements for each H ii region are shown at the corresponding positions in the top sub-panels. For the slit at the SN position we also show the O3N2 and R23 metallicity estimates, and the E(B − V) values that we computed through the measured Balmer decrements. (Bottom panel) Metallicity gradient of NGC 5682, see the bottom-panel caption of Fig. 6 for details. We also reported the N2 metallicity from the spectrum taken by SDSS at the center of the galaxy. |
| Open with DEXTER | |
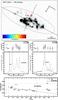 |
Fig. 11
(Top panel) Continuum-subtracted Hα image of NGC 5630, see the top-right panel caption of Fig. 7 for details. Here we show the positions of two slits. (Center panels) Flux at the Hα wavelength along the two slits, shown as a function of the distance from the SN location and from the nucleus. See the top-left panel caption of Fig. 7 for details. (Bottom panel) Metallicity gradient of NGC 5630, see the bottom-panel caption of Fig. 10 for details. |
| Open with DEXTER | |
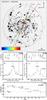 |
Fig. 12
(Top panel) Continuum-subtracted Hα image of UGC 6510, see the top-right panel caption of Fig. 7 for details. Here we show the positions of two slits, one for the NOT and one for the VLT spectrum. (Center panels) Flux at the Hα wavelength along the two slits, shown as a function of the distance from the SN location and from the nucleus. See the top-left panel caption of Fig. 7 for details. (Bottom panel) Metallicity gradient of UGC 6510, see the bottom-panel caption of Fig. 6 for details. |
| Open with DEXTER | |
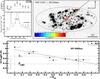 |
Fig. 13
(Top-right panel) Continuum-subtracted Hα image of UGC 11057, see the top-right panel caption of Fig. 7 for details. (Top-left panel) Flux at the Hα wavelength along the slit, see the top-left panel caption of Fig. 7 for details. (Bottom panel) Metallicity gradient of UGC 11057, see the bottom-panel caption of Fig. 7 for details. |
| Open with DEXTER | |
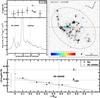 |
Fig. 14
(Top-right panel) Continuum-subtracted Hα image of NGC 4141, see the top-right panel caption of Fig. 7 for details. (Top-left panel) Flux at the Hα wavelength along the slit, see the top-left panel caption of Fig. 7 for details. (Bottom panel) Metallicity gradient of NGC 4141, see the bottom-panel caption of Fig. 10 for details. |
| Open with DEXTER | |
© ESO, 2013
Current usage metrics show cumulative count of Article Views (full-text article views including HTML views, PDF and ePub downloads, according to the available data) and Abstracts Views on Vision4Press platform.
Data correspond to usage on the plateform after 2015. The current usage metrics is available 48-96 hours after online publication and is updated daily on week days.
Initial download of the metrics may take a while.