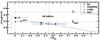
Fig. 10
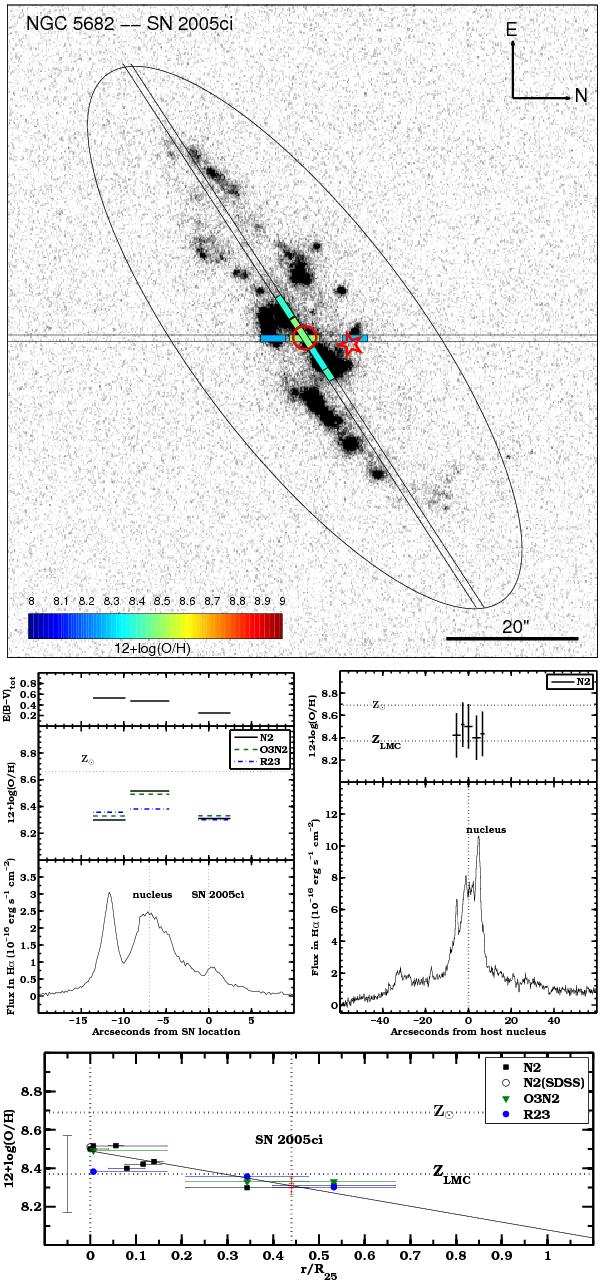
(Top panel) Continuum-subtracted Hα image of NGC 5682, see the top-right panel caption of Fig. 7 for details. Here we show the positions of two slits. (Center panels) Flux at the Hα wavelength along the two slits, shown as a function of the distance from the SN location and from the nucleus. These positions are marked by vertical dotted lines. The N2 measurements for each H ii region are shown at the corresponding positions in the top sub-panels. For the slit at the SN position we also show the O3N2 and R23 metallicity estimates, and the E(B − V) values that we computed through the measured Balmer decrements. (Bottom panel) Metallicity gradient of NGC 5682, see the bottom-panel caption of Fig. 6 for details. We also reported the N2 metallicity from the spectrum taken by SDSS at the center of the galaxy.
Current usage metrics show cumulative count of Article Views (full-text article views including HTML views, PDF and ePub downloads, according to the available data) and Abstracts Views on Vision4Press platform.
Data correspond to usage on the plateform after 2015. The current usage metrics is available 48-96 hours after online publication and is updated daily on week days.
Initial download of the metrics may take a while.