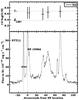
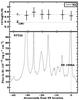
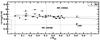
Fig. 6
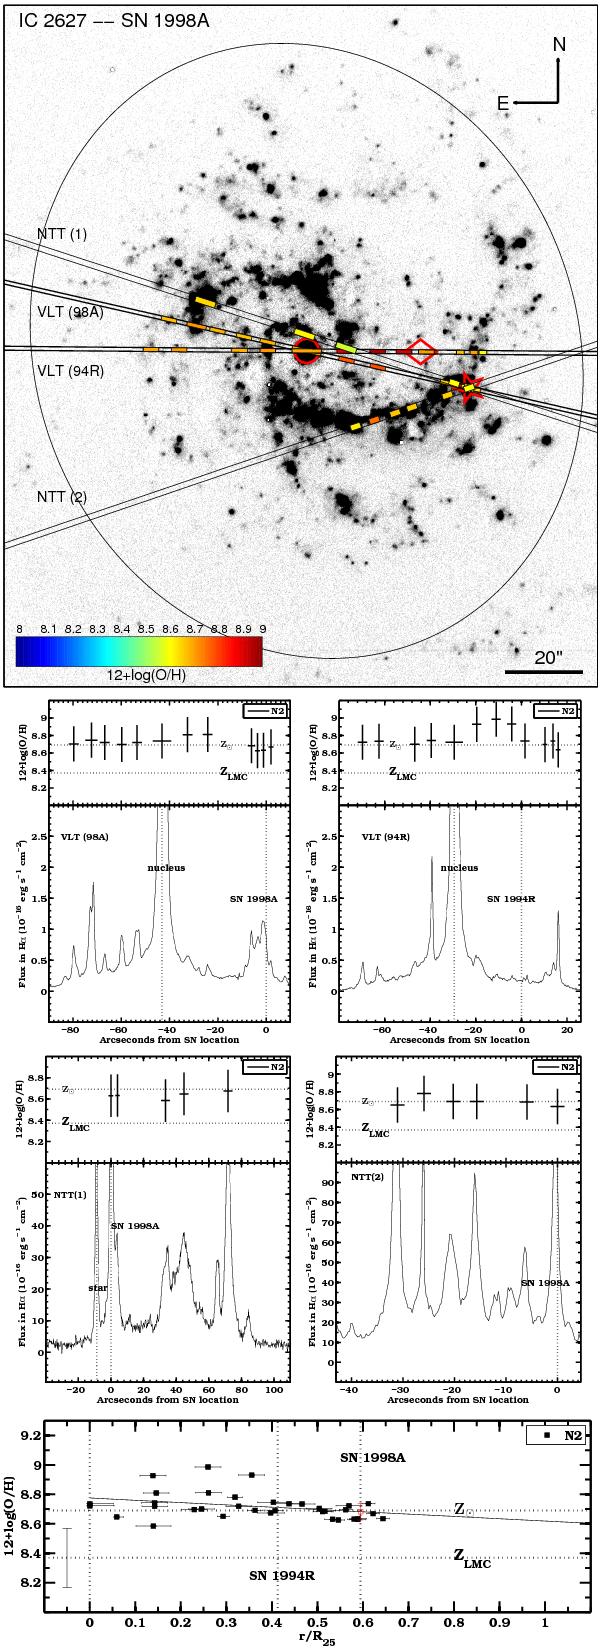
(Top panel) Continuum-subtracted Hα image of IC 2627. The 25th B-band magnitude elliptic contour is shown by a black solid line, along with the position of SN 1998A (marked by a red star), the center of the galaxy (marked by a red circle) and the position of SN 1994R (marked by a red diamond). The positions of the four slits are shown, and a color code is used to present the N2 metallicity measurements at the position of each H ii region that we inspected. (Center panels) Flux at the Hα wavelength along the four slits, shown as a function of the distance from the SN location. These positions are marked by dotted lines. The N2 measurements for each H ii region are shown at the corresponding positions in the upper sub-panels. (Bottom panel) Metallicity gradient of IC 2627. The linear fit on our measurements is shown by a solid line. The interpolated metallicity at the SN distance is marked by a red square and its uncertainty corresponds to the fit error. The error bar (±0.2 dex) for our N2 measurements is shown aside. The positions of SN and nucleus are marked by vertical dotted lines. The solar metallicity (Asplund et al. 2009) and the LMC metallicity (Russell & Dopita 1990) are indicated by two horizontal dotted lines.
Current usage metrics show cumulative count of Article Views (full-text article views including HTML views, PDF and ePub downloads, according to the available data) and Abstracts Views on Vision4Press platform.
Data correspond to usage on the plateform after 2015. The current usage metrics is available 48-96 hours after online publication and is updated daily on week days.
Initial download of the metrics may take a while.