| Issue |
A&A
Volume 558, October 2013
|
|
|---|---|---|
| Article Number | A67 | |
| Number of page(s) | 18 | |
| Section | Extragalactic astronomy | |
| DOI | https://doi.org/10.1051/0004-6361/201321768 | |
| Published online | 04 October 2013 | |
Online material
Appendix A: The SED fitting technique
The broad band SED fitting technique is a simple approach to infer the physical properties of a galaxy, such as stellar mass, SFR, amount of dust , age of stellar populations, by statistically comparing model and observed SED. The constraints on the physical parameters depend on the wavelength range spanned by the data and their quality. The COSMOS field, for which a wealth of multi-wavelength, high signal-to-noise ratio observations exist, is thus well suited for such modeling.
To derive the physical parameters, we adopt a library of SEDs based on the synthetic stellar population code from Bruzual & Charlot (2003, hererafter BC03). We describe the star formation history either with an exponentially declining function, with e-folding time 0.01 ≤ τ ≤ 15 Gyr, or with a constant. We adopt two metallicities, subsolar and solar (i.e., Z⊙, 0.2 Z⊙), and the IMF of Chabrier (2003), truncated at 0.1 and 100 M⊙. Since the maximum redshift of the galaxies in our sample is z ~ 1.3, we force the age of galaxies to be larger than 100 Myr, computed from the onset of SF which, in our case, corresponds to the initial burst. We also constrain the age of the galaxies not to exceed the age of the universe at any redshift. We do not adopt rising star formation histories, since these were developed to improve the SED fitting at high redshift (z ≥ 2, see Maraston et al. 2010). The prescriptions for TP-AGB stars adopted in BC03 produces a lower near-IR luminosity for intermediate age stellar populations with respect to the prescriptions of Maraston (2005). This affects the galaxy mass-to-light ratio, and produces a difference in the stellar mass estimated with Maraston et al. (2010) of ~–0.15 dex. The dust attenuation curve encodes informations about the nature of the dust grains (sizes, chemical compositions) and the spatial distributions of dust and stars. Boquien et al. (2009) have shown the necessity of adopting a range of attenuation laws to reproduce the observed scatter in the IRX vs. β relation. In particular, they show that a gray (i.e., shallow) attenuation curve, such as the starburst curve of Calzetti et al. (2000), and a steeper curve, such the SMC extinction curve of Prevot et al. (1984), are required to span the observed distribution in the IRX versus β diagram of the starbursting and normal star-forming galaxies. Similar conclusions are reached by Ilbert et al. (2009), who find that a range of attenuation curves is required to improve the photometric redshift accuracy via the SED fitting method. For these reasons, we adopt three different attenuation curves: a starburst, SMC-like laws and a curve with a slope in between them (λ-0.9). We then consider reddening excess in the range 0 ≤ E(B − V) ≤ 0.6, which allows us to explore the observed color distribution of our sample (see Fig. 3).
We use LePhare code (Arnouts et al. 1999; Ilbert et al. 2006) to compute the χ2 for each observed galaxy and the entire model library, with all the photometric passbands from 0.15 μm to 4.5 μm. The physical parameters are derived by computing the median of the marginalized likelihood for each parameter and the errors corresponding to the 68% credible region.
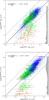 |
Fig. A.1
Comparison between the SFR (top panel) and sSFR (bottom panel) derived from the SED fitting and the IR+UV method (i.e., Eq. (1)). The mean errors on the SFR and sSFR estimated are shown as shaded region in the right side of the plots. The passive galaxies and the ones in the “intermediate” region of NUVrK diagran are shown as red triangles and green circles respectively. The mean and dispersion of the relation reported in each figure do not include the passive galaxies. |
| Open with DEXTER | |
In Fig. A.1, we compare the instantaneous SFR and sSFR derived with the SED fitting with the “total” SFR and sSFR derived from the observed IR and UV luminosities (i.e., Eq. (1)). The mean errorbars (based on 68% errors) for the SED parameters vary between 0.2 to 0.4, as shown by the gray region on the right side of the figures.
For the bulk of the 24 μm population the SFRs are in good agreement over ~3 order of magnitude, with a dispersion lower then a factor of two. The vast majority of sources with large discrepancies is located in the region occupied by passive galaxies (red triangles) or next to it, in the “intermediate” zone (green dots) as defined in Fig. 2. For those galaxies, the SED fitting predicts a low specific SFR (i.e., sSFRSED ≤ 10-10.5 yr-1). The origin of this difference may have multiple causes: an inadequate description of dust attenuation may cause the SED fitting to reject highly attenuated models and prefers models with low or no dust content and a low specific SFR. Alternatively the adopted definition of the total SFR in Eq. (1) may over-estimate the SFR, since we neglect the contribution of old stars to the dust heating ((1 − η)LIR). This contribution is often considered as 30% (η = 0.3) for star-forming galaxies (Inoue 2005) but it can be higher for the most evolved galaxies (e.g., Cortese & Hughes 2009). However, even an extreme value of η ~ 0.9 will not reconcile the estimated SFRs with the two methods. Another possibility is that the extrapolation of the 24 μm flux into the total IR luminosity could fail for galaxies with low specific SFR, if for exemple, a warmer dust temperature is associated to the same 24 μm flux with respect to galaxies in the star-forming main sequence, as recently reported by Skibba et al. (2011); Smith et al. (2012). It is beyond the scoop of this paper to address this issue, since we focus on the star-forming galaxies, but we find that ~7% of the entire 24 μm sample is affected by this mismatch in the SFR estimates.
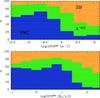 |
Fig. A.2
Relative contribution of the three attenuation laws (starburst [orange]; SMC [blue] and intermediate, ∝ λ-0.9 [green]) as a function of the specific SFR (top figure) and SFR (bottom figure) and derived from the SED modeling. |
| Open with DEXTER | |
In Fig. A.2, we show the relative contribution of the different attenuation laws, corresponding to the best-fit templates, as a function of the SFR and specific SFR. As mentioned above, the SMC-like extinction law is favored for galaxies with low SFR and/or low sSFR while the starburst law better fits the active/starbursting galaxies with high SFR and sSFR (sSFR ≥ − 9). Our results agree with Wuyts et al. (2011) with a transition for a steeper attenuation law at SFR ≤ 20 M⊙ yr-1. The most active galaxies are consistent with a mixed distribution of the dust and star resulting in the gray attenuation law (Calzetti et al. 2000), while “normal” star-forming galaxies prefer the SMC-like attenuation consistent with a simple dust screen model. See Sect. 5 and Chevallard et al. (2013) for a purely geometric origin of different attenuation laws.
In conclusion, our analysis shows that SFRs estimated via the SED fitting technique are in good agreement with those derived from the UV+IR contribution. This validates our method to derive the LIR from the 24 μm flux and the use of Eq. (1) as a good measure of the SFR. we have noted that Eq. (1)may become inadequate to describe the SFR in more evolved galaxies, possibly because of the presence of a larger population of old stars or the inadequate conversion of L24 μm to LIR. While this problem can not be easily solved, in this paper we show that we can isolate in the NUVrK diagram the region occupied by galaxies for which we obtain inconsistent SFR estimates with the different methods.
Appendix B: Separation between passive and active
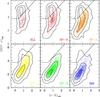 |
Fig. B.1
Distribution of the morphologically selected samples in the NUVrK diagram. The density contours (1/2, 1/10, 1/100 of the peak) refer to the whole morphological sample from Scarlata et al. (2007), while the dots refer to the 24 μm-select subsample. |
| Open with DEXTER | |
As the UVJ diagram proposed by Williams et al. (2009), in Sect. 2.3 and in Fig. 2, we define a criterion based on the NUVrK diagram to separate the passive and star-forming galaxies. To test the validity of the above color criterion, we show the distribution in the NUVrK diagram of galaxies with morphological information provided by the Zurich estimator of structural type (ZEST) catalog (Scarlata et al. 2007). The ZEST classification uses three morphological classes: Early type, Disk and Irregular, with subclasses describing the degree of “irregularity” in the early-type class (i.e., 0 for regular, 1 for irregular), and the contribution of the bulge for disk galaxies (i.e., from 0 for bulge dominated galaxies, to 3 for pure, bulge-less disks). We also consider the ellipticity class for the galaxies classified as disks. This traces the galaxy inclination with an ellipticity of 0 corresponding to a face-on galaxy and up to 3 for an edge-on galaxy. The ZEST catalog includes galaxies down to IAB ≤ 24 and we restrict the sample to galaxies with good flags. The distributions of the different morphological classes in the NUVrK diagram are shown in Fig. B.1 for the whole ZEST sample (as density contours) and for the 24 μm selected subsample (small dots). We detect a clear evolutionary sequence in this diagram, with the Irregular (IRR) and Spiral-disk dominated (Sp-3, and Sp-2) galaxies showing only blue colors, typical of active star-forming galaxies. The Spirals with a growing contribution of bulge (Sp-1 and Sp-0) and the early-types (ELL) show an increasing fraction of their population to lie in the passive region (i.e., top-left side) of the diagram. The 24 μm sample tends to lie in the blue plums of the early type (ELL) and bulge dominated spiral (Sp-0) samples. The blue plum in the early type class could be due to some residual of star formation activities (the plum is present in the two subclasses based on the regularity criterion: ELL-0 and ELL-1).
The Spiral disk-dominated population (Sp-3, and Sp-2) extend to relatively red colors in (NUV − r) and (r − K) (top-right part of the diagram), where high values of IRX are also observed. As discussed by Patel et al. (2011), in the UVJ diagram, the disk inclination can be indeed responsible for this extreme reddening. This is indeed supported by Fig. B.2, where we show the mean values of the ellipticity parameter for the disk population, in different redshift bins (see also the discussion in Sect. 5).
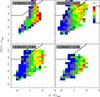 |
Fig. B.2
Mean value of the ellipticities (color coded) in the NUVrK diagram for the morphological sample from Scarlata et al. (2007). |
| Open with DEXTER | |
Appendix C: The average spectral energy distributions along the vector NRK
The evolution of ⟨IRX⟩ with NRK vector should be reflected in the shape of the galaxy SEDs when moving from low to high value of NRK. In Fig. C.1, we have reconstructed the averaged rest-frame SEDs in different bins of NRK, redshift and stellar mass, by using the 31 broad and medium bands available in the COSMOS catalog. They are reconstructed in logarithmic wavelength bins (Δlog (λ) = 0.15). Before computing the average and the dispersion in each wavelength bin, the low resolution spectrum of all the galaxies was first normalized at λ ~ 0.5 μm (dashed lines). In each panel, we show the number of galaxies used to reconstruct the averaged SEDs and as an indicative value of the IRX, we show the ratio log (FIR/FNUV), where the FIR is the redshift corrected 24 μm flux of the averaged SED (F24 μ/(1 + z)) and FNUV the rest-frame flux at 0.23 μm (F0.23 μ). As a reference, we overplot the template of a young star-forming galaxy (SB24 from Ilbert et al. 2009). For the first bin 0.5 ≤ NRK ≤ 1, corresponding to the bluest population in our sample, no attenuation is applied to the template. For the three other bins of NRK, we increase the amount of dust reddening to E(B − V) = 0.2,0.4,0.6, assuming a starburst attenuation law (solid black lines) and a SMC extinction law (gray dashed lines).
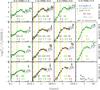 |
Fig. C.1
Evolution of the average rest-frame SEDs with NRK for the 24 μm-selected sample. Each SED is reconstructed by using all the available COSMOS pass-bands. Galaxies are divided in bins of NRK (columns of the figure), redshift (rows) and stellar mass (blue, green and red symbols in each panel). The number of galaxies for each sample is shown in each panel. We also report the logarithm of the mean ratio FIR/FUV as an indicative value of the IRX. In the first bin of NRK (i.e., first column of the figure) we overplot the dust-free template of young star-forming galaxy. In the other three bins of NRK (i.e., three right-most columns) we overplot the same template, but with increasing reddening excess (E(B − V) = 0.2, 0.4 ,0.6, respectively), assuming the Calzetti et al. (2000) attenuation law (solid, black line) and the SMC extinction law (dashed, gray line). The three vertical bands refer to the bandwidths of the NUV, r and K filters. |
| Open with DEXTER | |
A strong evolution of the SED shape is observed with increasing NRK. We can quantitatively reproduce this evolution by increasing the reddening excess applied to our SB2 star-forming template. On the other hand, redshift and stellar mass appear to play a secondary role in shaping the SED properties. This provides an additional evidence that NRK is sensitive to the global budget between UV and Far-IR emission in galaxies, regardless of other properties. It also supports our choice of neglecting the dependence on the stellar mass in Eq. (3). However, in Le Floc’h et al. (in prep.) we extend our analysis to a complete mass selected sample using the stacking technique at 24, 220, 350 and 500 μm and we show that the ⟨IRX⟩ vs. NRK relation should include a corrective term based on stellar mass when considering galaxies with stellar masses M⋆ ≤ 109.3 M⊙.
Appendix D: Dependence with sSFR
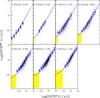 |
Fig. D.1
The predicted specific SFR (sSFRNRK) vs. the reference sSFR (sSFRtot) for the star-forming population in the local SWIRE (top left panel) and COSMOS (other panels) samples. The mean and the sigma per bin of sSFRtot are shown as blue symbols and the solid lines show the analytical fit described in the text. The yellow area corresponds to the limit where SFRNRK > 2 × SFRtot. |
| Open with DEXTER | |
As observed in Fig. 8, the difference between the IR luminosity derived from the 24 μm observations and the NRK method varies with the specific SFR. In particular, we have shown that the NRK method over-estimates LIR for galaxies with low sSFR. In Fig. D.1 we compare, in different redshift bins, the predicted specific SFR (sSFRNRK) with the reference sSFR (derived with the 24 μm, sSFRtot), with both sSFR estimated with Eq. (1). The sSFRNRK tends to saturate while the true sSFR keeps declining toward galaxies with low star formation activity, and this deviation varies with redshift. We propose an analytical fit which allows us to reproduce this deviation over the entire redshift range:  (D.1)\vspace*{1mm}where, y0 = log (sSFRNRK) + 9.5, a(z) = −1.4 + 0.8 z and b(z) = −0.1 (1 − z) and z is the redshift. By mean of this equation, we can define a sSFR threshold below which the NRK method over-estimates the SFR by a given factor. By chosing a factor 2, the redshift evolution of this threshold can be simply described by sSFRNRKlim(z) = −10.6 + 0.8 z. These thresholds are shown as shaded yellow regions in Fig. D.1.
© ESO, 2013
Current usage metrics show cumulative count of Article Views (full-text article views including HTML views, PDF and ePub downloads, according to the available data) and Abstracts Views on Vision4Press platform.
Data correspond to usage on the plateform after 2015. The current usage metrics is available 48-96 hours after online publication and is updated daily on week days.
Initial download of the metrics may take a while.