Fig. D.1
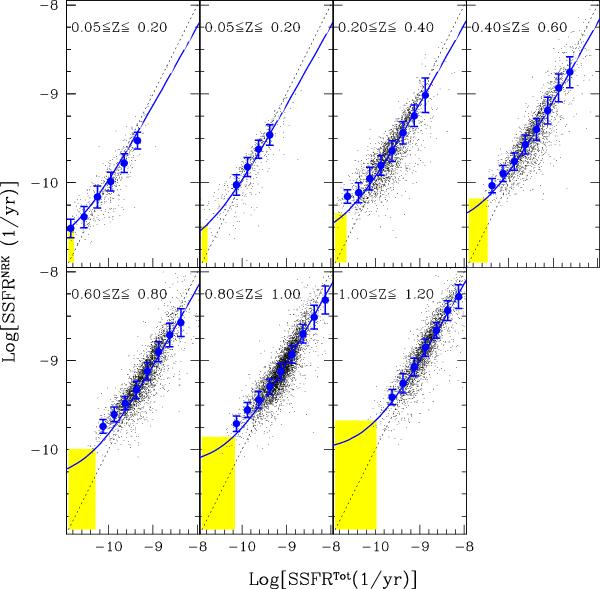
The predicted specific SFR (sSFRNRK) vs. the reference sSFR (sSFRtot) for the star-forming population in the local SWIRE (top left panel) and COSMOS (other panels) samples. The mean and the sigma per bin of sSFRtot are shown as blue symbols and the solid lines show the analytical fit described in the text. The yellow area corresponds to the limit where SFRNRK > 2 × SFRtot.
Current usage metrics show cumulative count of Article Views (full-text article views including HTML views, PDF and ePub downloads, according to the available data) and Abstracts Views on Vision4Press platform.
Data correspond to usage on the plateform after 2015. The current usage metrics is available 48-96 hours after online publication and is updated daily on week days.
Initial download of the metrics may take a while.