Free Access
Fig. B.1
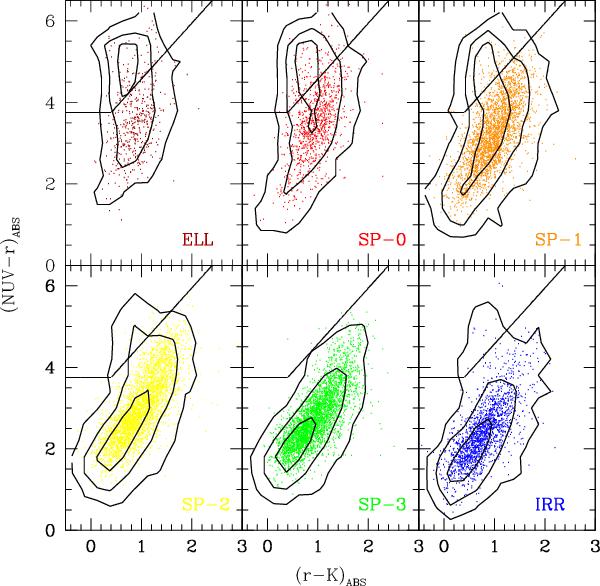
Distribution of the morphologically selected samples in the NUVrK diagram. The density contours (1/2, 1/10, 1/100 of the peak) refer to the whole morphological sample from Scarlata et al. (2007), while the dots refer to the 24 μm-select subsample.
Current usage metrics show cumulative count of Article Views (full-text article views including HTML views, PDF and ePub downloads, according to the available data) and Abstracts Views on Vision4Press platform.
Data correspond to usage on the plateform after 2015. The current usage metrics is available 48-96 hours after online publication and is updated daily on week days.
Initial download of the metrics may take a while.