| Issue |
A&A
Volume 557, September 2013
|
|
|---|---|---|
| Article Number | A94 | |
| Number of page(s) | 31 | |
| Section | Interstellar and circumstellar matter | |
| DOI | https://doi.org/10.1051/0004-6361/201321589 | |
| Published online | 09 September 2013 | |
Online material
Appendix A: Figures, molecular line results, and spectral energy distributions
In Fig. A.1, we present different panels for each observed source (including the spectra at 3 mm), zero-order moment (integrated intensity) maps for different molecular lines, and a comparison between the emission at 8 μm and at submillimeter (500 μm or 850 μm) wavelengths. In Table A.1, we list the detection of molecules toward the 14 high-mass YSOs, while in Table A.2, we list the hyperfine structure fit results and physical parameters of the dense cores derived from the N2H+ (1−0) and C2H (1−0) lines. In Table A.3, we present continuum fluxes measured for the 14 sources, in the wavelength range from 8.0 μm to 1.2 mm, including data from different facilities: MSX, Spitzer/MIPS, IRAS, Herschel/PACS, Herschel/SPIRE, JCMT, APEX, and IRAM 30 m. Finally, in Fig. A.2 we show the SEDs for the 14 objects, with the observational parameters listed in Table A.3 and the best fit as explained in Sect. 3.3.
Molecular lines detected at 3 mm toward the 14 high-mass young stellar objects.
Hyperfine structure fit results and physical parameters of dense cores derived from N2H+ (1−0) and C2H (1−0) lines.
Measured continuum fluxes, in Jy, from mid-IR to millimeter wavelengths.
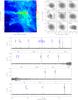 |
Fig. A.1
Top-left: Hi-GAL 500 μm (or JCMT 850 μm) continuum image in contours overlaid on the Spitzer/IRAC 8.0 μ (or MSX 8.3 μm) image in color scale. The box show the region mapped with the IRAM 30-m telescope. Top-right: nine panels with the zero-order moment (velocity-integrated intensity) maps of different molecular species (labeled in the top-left corner of each panel). The minimum and maximum contour level (in units K km s-1) is indicated in the bottom part of each panel. Bottom: four panels with the IRAM 30-m spectra at 3 mm, covering a frequency range from 87.6 GHz to 93.4 GHz. |
| Open with DEXTER | |
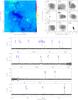 |
Fig. A.1
continued, for G19.27+0.1 M2. |
| Open with DEXTER | |
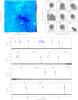 |
Fig. A.1
continued, for G19.27+0.1 M1. |
| Open with DEXTER | |
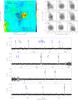 |
Fig. A.1
continued, for 18 236−1205. |
| Open with DEXTER | |
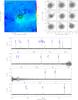 |
Fig. A.1
continued, for 18 264−1152. |
| Open with DEXTER | |
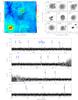 |
Fig. A.1
continued, for G23.60+0.0 M1. |
| Open with DEXTER | |
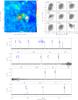 |
Fig. A.1
continued, for 18 316−0602. |
| Open with DEXTER | |
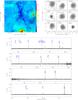 |
Fig. A.1
continued, for G23.60+0.0 M2. |
| Open with DEXTER | |
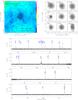 |
Fig. A.1
continued, for G24.33+0.1 M1. |
| Open with DEXTER | |
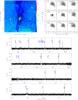 |
Fig. A.1
continued, for G34.43+0.2 M1. |
| Open with DEXTER | |
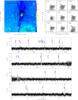 |
Fig. A.1
continued, for 18 507+0121. |
| Open with DEXTER | |
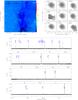 |
Fig. A.1
continued, for G34.43+0.2 M3. |
| Open with DEXTER | |
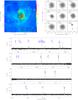 |
Fig. A.1
continued, for 19 095+0930. |
| Open with DEXTER | |
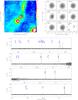 |
Fig. A.1
continued, for 23 139+5939. |
| Open with DEXTER | |
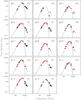 |
Fig. A.2
Spectral energy distributions for the 14 sources listed in Table 1. Black dots correspond to measured continuum fluxes in the range 8 μm to 1.2 mm (see Table A.3), while the crosses correspond to upper limits. Red dots correspond to the new Hi-GAL data (Molinari et al. 2010a,b). White triangles correspond to IRAS fluxes at 60 μm and 100 μm not considered in the SED fitting when there is available Hi-GAL data. The solid curve represents the best fit to the data points with wavelengths ≥60 μm (see Sect. 3.3). |
| Open with DEXTER | |
© ESO, 2013
Current usage metrics show cumulative count of Article Views (full-text article views including HTML views, PDF and ePub downloads, according to the available data) and Abstracts Views on Vision4Press platform.
Data correspond to usage on the plateform after 2015. The current usage metrics is available 48-96 hours after online publication and is updated daily on week days.
Initial download of the metrics may take a while.