Fig. A.2
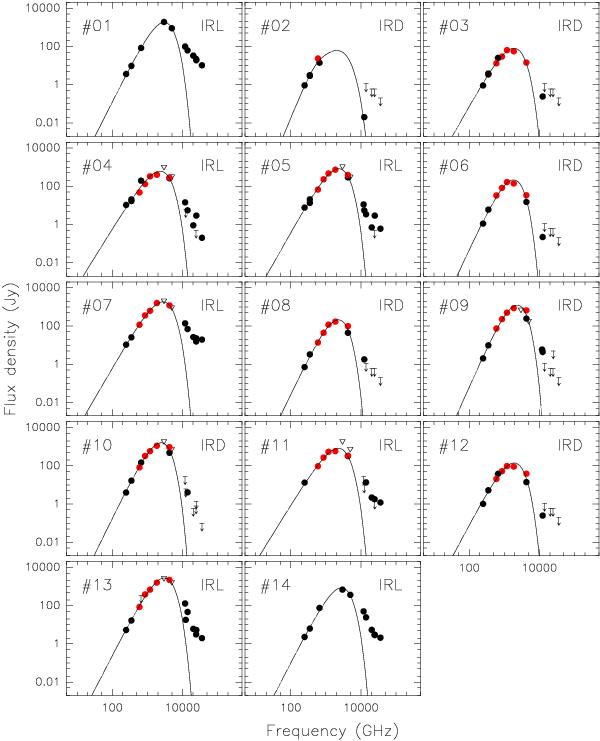
Spectral energy distributions for the 14 sources listed in Table 1. Black dots correspond to measured continuum fluxes in the range 8 μm to 1.2 mm (see Table A.3), while the crosses correspond to upper limits. Red dots correspond to the new Hi-GAL data (Molinari et al. 2010a,b). White triangles correspond to IRAS fluxes at 60 μm and 100 μm not considered in the SED fitting when there is available Hi-GAL data. The solid curve represents the best fit to the data points with wavelengths ≥60 μm (see Sect. 3.3).
Current usage metrics show cumulative count of Article Views (full-text article views including HTML views, PDF and ePub downloads, according to the available data) and Abstracts Views on Vision4Press platform.
Data correspond to usage on the plateform after 2015. The current usage metrics is available 48-96 hours after online publication and is updated daily on week days.
Initial download of the metrics may take a while.