Fig. A.1
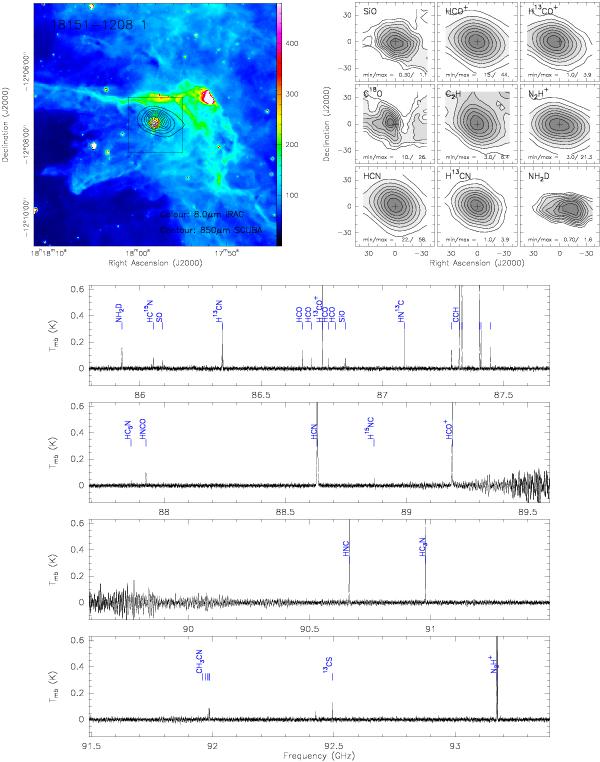
Top-left: Hi-GAL 500 μm (or JCMT 850 μm) continuum image in contours overlaid on the Spitzer/IRAC 8.0 μ (or MSX 8.3 μm) image in color scale. The box show the region mapped with the IRAM 30-m telescope. Top-right: nine panels with the zero-order moment (velocity-integrated intensity) maps of different molecular species (labeled in the top-left corner of each panel). The minimum and maximum contour level (in units K km s-1) is indicated in the bottom part of each panel. Bottom: four panels with the IRAM 30-m spectra at 3 mm, covering a frequency range from 87.6 GHz to 93.4 GHz.
Current usage metrics show cumulative count of Article Views (full-text article views including HTML views, PDF and ePub downloads, according to the available data) and Abstracts Views on Vision4Press platform.
Data correspond to usage on the plateform after 2015. The current usage metrics is available 48-96 hours after online publication and is updated daily on week days.
Initial download of the metrics may take a while.