| Issue |
A&A
Volume 556, August 2013
|
|
|---|---|---|
| Article Number | A16 | |
| Number of page(s) | 38 | |
| Section | Interstellar and circumstellar matter | |
| DOI | https://doi.org/10.1051/0004-6361/201321456 | |
| Published online | 18 July 2013 | |
Online material
Appendix A: Comments on individual sources
Appendix A.1: 16061−5048c4 and 16435−4515c3
16061−5048c4 is included in the SFS due to the presence of a water maser. No clear mid-IR emission can be seen in the Spitzer images, suggesting a clump in very early stages of evolution or a very high extinction.
For example, Breen & Ellingsen (2011) suggest that a maser is one of the first sign of active star formation to appear. This is because the maser is likely excited by the outflow, the onset of which happens in a phase where the mid-IR emission may still be too weak to be detected. This seems to be consistent with the position of this source in the M-L plot. This is, in fact, one of the objects with the lowest kinetic temperature in the SFS and with a very low luminosity.
However, 16061−5048c4, in addition to the maser, shows a clear detection in the radio-continuum emission. Visual inspection of the radio image shows an elongated morphology of the emission at this wavelength, following closely the shape of the mm-clump, and displaced towards South-East. We conclude that this is not a compact Hii region produced by the central YSO, but an ionization front generated by a nearby massive star (most likely the corresponding IRAS source), rather than by the YSO.
A similar situation is observed in 16435−4515c3. This clump shows no signs of active star formation, apart from radio emission. It could be that also in this case this emission comes from an ionization front outside the clump. In any case, this source was excluded from the analysis because the NH3(2, 2) was not detected.
Appendix A.2: 17355−3241c1
As evolution proceeds, the massive ZAMS star delivers huge quantities of ionizing photons and energetic particles into the parent molecular cloud. This process disperses the clump, leaving only remnants of the original cloud, around an Hii region.
17355−3241c1 is the most evolved source in our sample, as can be seen in the mass-luminosity plot. This is the only Type 3 source in our sample, with still a detectable 1.2 mm flux, but with dominant IR-emission.
The properties of this clump appear to confirm the evolutionary scenario: it has the
lowest mass, column and surface density of the entire sample, and a high temperature
and luminosity. Moreover, the L/M ratio is the highest among all the observed clumps,
above  .
The virial parameter α (~3.5) is the highest. This could be due to
the destructive action of the central ZAMS star, dispersing the clump from which it
was formed. On the other hand, this object does not show compact radio-continuum
emission. The M − L plot shows that the mass of the
central ZAMS star should be M ~ 6 M⊙,
corresponding to a B5 star, comparing its position in the
M − L plot with the evolutionary tracks. The
output of Lyman continuum photons of such a star is low, and below the detection limit
of the radio observations (cf. Thompson 1984;
Sánchez-Monge et al. 2013a). However the
uncertainty on the stellar mass is quite large. The SED fit with Robitaille models
suggests a stellar mass of ~8 M⊙. Another possibility to
explain the lack of radio continuum emission is that it is extended and filtered out
by the interferometer.
.
The virial parameter α (~3.5) is the highest. This could be due to
the destructive action of the central ZAMS star, dispersing the clump from which it
was formed. On the other hand, this object does not show compact radio-continuum
emission. The M − L plot shows that the mass of the
central ZAMS star should be M ~ 6 M⊙,
corresponding to a B5 star, comparing its position in the
M − L plot with the evolutionary tracks. The
output of Lyman continuum photons of such a star is low, and below the detection limit
of the radio observations (cf. Thompson 1984;
Sánchez-Monge et al. 2013a). However the
uncertainty on the stellar mass is quite large. The SED fit with Robitaille models
suggests a stellar mass of ~8 M⊙. Another possibility to
explain the lack of radio continuum emission is that it is extended and filtered out
by the interferometer.
Finally, we remind that in both cases the stellar mass is an upper limit, under the assumption that the luminosity is dominated by the most massive object.
The SED of this object is different from that typical of the other objects with appreciable emission in the mid-IR, being almost flat in terms of energy up to 3.6 μm. Also the Robitaille model indicates that this is an older object.
Appendix A.3: Undetected sources
A number of sources do not have detections in ammonia, especially in the (2, 2) transition. Among the SFS, they are weak also in (1, 1), suggesting low beam-averaged NH3 column densities. 16164−4929c2 and 14166−6118c1 have a clear detection at 1.2 mm, but no ammonia counterpart. Near-IR images show that these two objects contain a star cluster. The SED, the morphology of the IR emission and radio-continuum observations of these two clumps show that they host a massive ZAMS star, that has already developed an Hii region, different from the nearby clumps detected in ammonia. 13563−6109c1 also shows signs of the presence of a recognizable embedded cluster in near-IR images, even if not as clear as 16164−4929c2 and 14166−6118c1.
On the other hand, four more sources with similar properties are found in the QS, but without clear signs of an embedded cluster. Two of these have quite strong NH3(1, 1) detections, indicating very low gas temperatures. These clumps might be just too cold to be detected in (2, 2) or simply not massive enough to form stars with M > 8 M⊙.
Finally, also 15454−5335c2 was not detected in ammonia. This source was identified at the edge of the SEST map. No IR source was found to be associated with it. The non-detection in NH3 and visual inspection of the SEST map suggest that this might be just a noise spike in the SEST 1.2 mm continuum map.
Appendix B: SED fit
The modified black-body fit was done with a simple Bayesian approach, considering Gaussian uncertainties on the fluxes, taking into account the rms of the image and the calibration uncertainty at each wavelength (15% for SEST and SPIRE, 20% for PACS red and 10% for PACS blue fluxes: Beltrán et al. 2006; Swinyard et al. 2010; Poglitsch et al. 2010). We adopted a modified black body as a model, comparing the observed and predicted fluxes at each wavelength, and multiplying the probability for each point, to obtain the total probability of the model. We took a constant prior on the mass, while we used a Gaussian prior on β, with mean value μ = 2 and standard deviation σ = 2, and on the dust temperature Td, with μ = 20 K and σ = 15 K. We considered temperatures between 5 and 50 K in 200 equal linear steps, masses between 10 and 10 000 M⊙ in 200 equal logarithmic steps, and β between 0.1 and 4, in 40 equal linear steps. To test the dependence of the fit on the choice of prior, we also tried to use a constant prior on all the parameters of the fit. The results show that Td, M and β are not sensitive to this choice, within the uncertainties. To derive the probability distribution, and thus the uncertainty on the single parameters we integrated over the other two parameters.
Appendix C: Tables and figures
Properties of each clump, averaged within the FWHM contour.
Properties of each clump, averaged within the 3σ contour.
Summary of star formation signposts for all the observed clumps.
Mean and median values for temperatures, luminosity, dust emissivity index β, L/M ratio, gas properties and diameters of the clumps in the QS and the SFS averaged within the FWHM contour of the 1.2 mm continuum emission.
Mean and median values for temperatures, luminosity, L/M ratio, gas properties and diameters averaged within the FWHM contour of the 1.2 mm continuum emission of the clumps in the SFS, divided in SFS-1 and SFS-2. The pairs of columns show respectively: kinetic temperature, dust temperature, diameter, column density, volume density, surface density, luminosity and L/M ratio.
Parameters of the ammonia spectra averaged over the whole NH3(1, 1) area of emission.
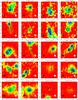 |
Fig. C.1
a) Colorscale: SEST 1.2 mm; contours: NH3(1, 1) zeroth moment. The contours start from 15% of the peak, in step of 15% of the peak integrated emission. The peak flux and the ΔV of the line are given in Table 2. The position of each clump in our sample is indicated by a black cross. The SEST beam is indicated as a white circle, and the ATCA beam is shown as a black circle. The IRAS name is indicated above each panel, and the clump names are shown in the figures. The fields with poor uv-coverage (see Sect. 3) are not used to produce overlays, as the maps produced are not as reliable as the others. |
| Open with DEXTER | |
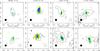 |
Fig. C.1
b) Colorscale: NH3(1, 1) zeroth moment; contours: SEST 1.2 mm. In this panel the colorscale and contours have been swapped in order to make the figure intelligible. The SEST contours are optimized to identify the clump. The position of each clump in our sample is indicated by a black cross. The SEST beam is indicated as a white circle, and the ATCA beam is shown as a black circle. The IRAS name is indicated above each panel, and the clump names are shown in the figures. The fields with poor uv-coverage (see Sect. 3) are not used to produce overlays, as the maps produced are not as reliable as the others. |
| Open with DEXTER | |
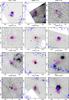 |
Fig. C.2
SEST 1.2 mm emission (contours) superimposed on the Spitzer/MIPS 24 μm images. The IRAS name is indicated above each panel, and the clump names are shown in the figures. Dashed and solid red lines indicate the ATCA field and the observed clumps, respectively. H2O maser spots are shown as white open squares, while “green fuzzies” are indicated as green open circles. In the last four panels the SEST emission is superimposed on MSX images. Purple lines indicate the 3σ and FWHM polygons used to extract fluxes from the SEST images. |
| Open with DEXTER | |
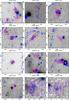 |
Fig. C.2
continued. |
| Open with DEXTER | |
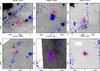 |
Fig. C.2
continued. |
| Open with DEXTER | |
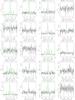 |
Fig. C.3
NH3(1, 1) and (2, 2) spectra extracted at the peak of NH3(1, 1) emission for all clumps. The clump name and transition are indicated above each panel. |
| Open with DEXTER | |
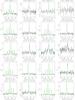 |
Fig. C.3
continued. |
| Open with DEXTER | |
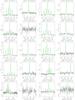 |
Fig. C.3
continued. |
| Open with DEXTER | |
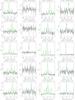 |
Fig. C.3
continued. |
| Open with DEXTER | |
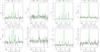 |
Fig. C.3
continued. |
| Open with DEXTER | |
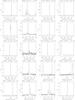 |
Fig. C.4
H2O maser spectra. The clump name and the offset of the maser w.r.t. the phase centre are indicated above each panel. |
| Open with DEXTER | |
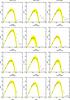 |
Fig. C.5
Spectral energy distributions for the SFS. Uncertainties in the fluxes are indicated. The yellow-shaded area shows the region encompassed by the extreme values of the fit-derived parameters for the modified black body. |
| Open with DEXTER | |
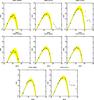 |
Fig. C.5
continued. |
| Open with DEXTER | |
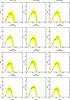 |
Fig. C.6
Same as Fig. C.5, but for the QS. |
| Open with DEXTER | |
© ESO, 2013
Current usage metrics show cumulative count of Article Views (full-text article views including HTML views, PDF and ePub downloads, according to the available data) and Abstracts Views on Vision4Press platform.
Data correspond to usage on the plateform after 2015. The current usage metrics is available 48-96 hours after online publication and is updated daily on week days.
Initial download of the metrics may take a while.