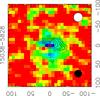
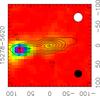
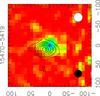
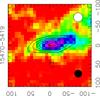
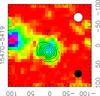
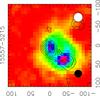
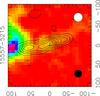
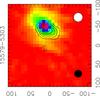
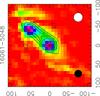
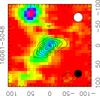
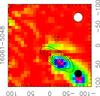
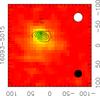
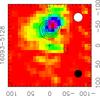
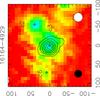
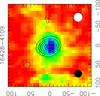
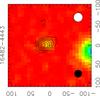
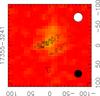
Fig. C.1
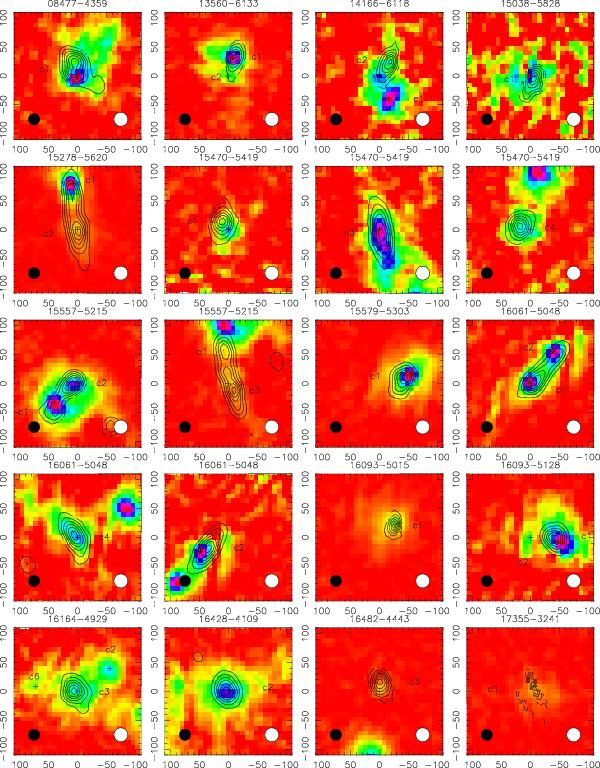
a) Colorscale: SEST 1.2 mm; contours: NH3(1, 1) zeroth moment. The contours start from 15% of the peak, in step of 15% of the peak integrated emission. The peak flux and the ΔV of the line are given in Table 2. The position of each clump in our sample is indicated by a black cross. The SEST beam is indicated as a white circle, and the ATCA beam is shown as a black circle. The IRAS name is indicated above each panel, and the clump names are shown in the figures. The fields with poor uv-coverage (see Sect. 3) are not used to produce overlays, as the maps produced are not as reliable as the others.
Current usage metrics show cumulative count of Article Views (full-text article views including HTML views, PDF and ePub downloads, according to the available data) and Abstracts Views on Vision4Press platform.
Data correspond to usage on the plateform after 2015. The current usage metrics is available 48-96 hours after online publication and is updated daily on week days.
Initial download of the metrics may take a while.