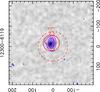
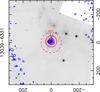
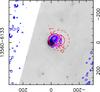
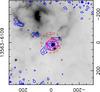
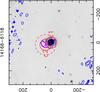
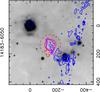
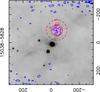
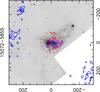
Fig. C.2
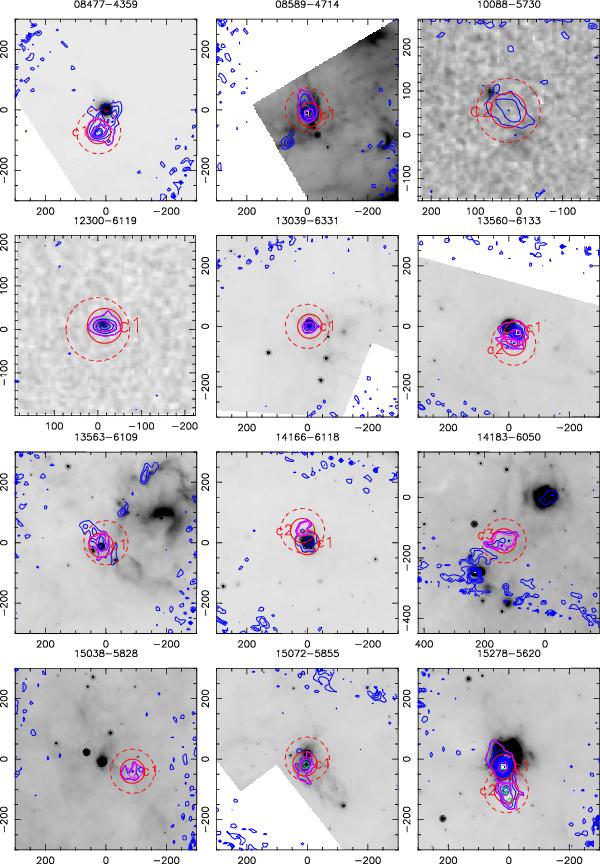
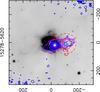
SEST 1.2 mm emission (contours) superimposed on the Spitzer/MIPS 24 μm images. The IRAS name is indicated above each panel, and the clump names are shown in the figures. Dashed and solid red lines indicate the ATCA field and the observed clumps, respectively. H2O maser spots are shown as white open squares, while “green fuzzies” are indicated as green open circles. In the last four panels the SEST emission is superimposed on MSX images. Purple lines indicate the 3σ and FWHM polygons used to extract fluxes from the SEST images.
Current usage metrics show cumulative count of Article Views (full-text article views including HTML views, PDF and ePub downloads, according to the available data) and Abstracts Views on Vision4Press platform.
Data correspond to usage on the plateform after 2015. The current usage metrics is available 48-96 hours after online publication and is updated daily on week days.
Initial download of the metrics may take a while.