| Issue |
A&A
Volume 556, August 2013
|
|
|---|---|---|
| Article Number | A42 | |
| Number of page(s) | 11 | |
| Section | Extragalactic astronomy | |
| DOI | https://doi.org/10.1051/0004-6361/201321455 | |
| Published online | 23 July 2013 | |
Online material
Appendix A: Smoothing the CALIFA cubes
The following figures show the effect of smoothing the high (V1200) and low-resolution (V500) CALIFA cubes in the spectral direction on the resulting CCM extinction curve fits, both the normalization (AV) and slope (RV).
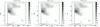 |
Fig. A.1
Extinction in the overlap region (green box in Fig. 6) in the V500 cube. The spectra were not smoothed (left panel), and smoothed by 10 and 14 Å (middle and right panels respectively) before a CCM extinction curve was fit to it. These panels show the normalization (AV) of the fit. |
| Open with DEXTER | |
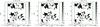 |
Fig. A.2
Extinction law in the overlap region (green box in Fig. 6) in the V500 cube. The spectra were not smoothed (left panel), and smoothed by 10 and 14 Å (middle and right panels respectively) before a CCM extinction curve was fit to it. These panels show the slope (RV) of the fit. |
| Open with DEXTER | |
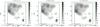 |
Fig. A.3
Extinction in the overlap region (green box in Fig. 6) in the first part of the V1200 cube. The spectra were not smoothed (left panel), and smoothed by 3.5 and 4.9 Å (middle and right panels respectively) before a CCM extinction curve was fit to it. These panels show the normalization (AV) of the fit. |
| Open with DEXTER | |
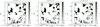 |
Fig. A.4
Extinction curve in the overlap region (green box in Fig. 6) in the first part of the V1200 cube. The spectra were not smoothed (left panel), and smoothed by 3.5 and 4.9 Å (middle and right panels respectively) before a CCM extinction curve was fit to it. These panels show the slope (RV) of the fit. |
| Open with DEXTER | |
© ESO, 2013
Current usage metrics show cumulative count of Article Views (full-text article views including HTML views, PDF and ePub downloads, according to the available data) and Abstracts Views on Vision4Press platform.
Data correspond to usage on the plateform after 2015. The current usage metrics is available 48-96 hours after online publication and is updated daily on week days.
Initial download of the metrics may take a while.