Free Access
Fig. A.4
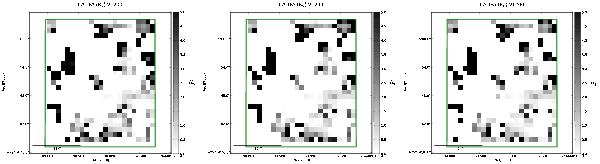
Extinction curve in the overlap region (green box in Fig. 6) in the first part of the V1200 cube. The spectra were not smoothed (left panel), and smoothed by 3.5 and 4.9 Å (middle and right panels respectively) before a CCM extinction curve was fit to it. These panels show the slope (RV) of the fit.
Current usage metrics show cumulative count of Article Views (full-text article views including HTML views, PDF and ePub downloads, according to the available data) and Abstracts Views on Vision4Press platform.
Data correspond to usage on the plateform after 2015. The current usage metrics is available 48-96 hours after online publication and is updated daily on week days.
Initial download of the metrics may take a while.