| Issue |
A&A
Volume 556, August 2013
|
|
|---|---|---|
| Article Number | A143 | |
| Number of page(s) | 50 | |
| Section | Interstellar and circumstellar matter | |
| DOI | https://doi.org/10.1051/0004-6361/201321285 | |
| Published online | 09 August 2013 | |
Online material
Appendix A: Figures and tables
SO emission line parameters obtained from Gaussian fits.
SO2 parameters from Gaussian fits (lines at 1.3 mm).
SO2 parameters from Gaussian fits (lines at 2−3 mm).
Rotational temperatures, Trot, and column densities, N, obtained from rotational diagrams.
Isotopologue ratios and molecular ratios.
Molecular abundances, X.
Column density upper limits for undetected sulfur-bearing molecules in Orion KL.
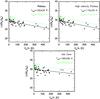 |
Fig. A.1
Rotational diagrams for the plateau, high-velocity plateau, and hot core components. Black dots for SO2 and green dots for SO. The black and green lines are the best linear fits to the SO2 and SO points, respectively. |
| Open with DEXTER | |
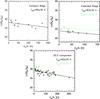 |
Fig. A.2
Rotational diagrams for the compact ridge, extended ridge, and 20.5 km s-1 component. Black dots for SO2 and green dots for SO. The black and green lines are the best linear fits to the SO2 and SO points, respectively. |
| Open with DEXTER | |
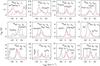 |
Fig. A.3
Observed lines of 33SO (black histogram) and best fit LVG model results (red). |
| Open with DEXTER | |
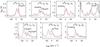 |
Fig. A.4
Observed lines of S18O (black histogram) and best fit LVG model results (red). |
| Open with DEXTER | |
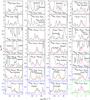 |
Fig. A.5
Observed lines of 33SO2 (black histogram) and best fit LTE model (red). Boxes in black, blue, and green correspond to frequencies at 1.3, 2, and 3 mm, respectively. |
| Open with DEXTER | |
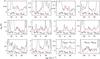 |
Fig. A.6
Observed lines of SO18O (black histogram) and best fit LTE model (red). |
| Open with DEXTER | |
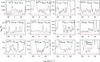 |
Fig. A.7
Observed lines of SO17O (black histogram) and best fit LTE model (red). |
| Open with DEXTER | |
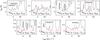 |
Fig. A.8
Observed lines of 34SO2ν2 = 1 (black histogram) and best fit LTE model (red). |
| Open with DEXTER | |
Observed lines of SO and its isotopologues.
Observed lines of SO2, its isotopologues, and vibrationally excited states.
© ESO, 2013
Current usage metrics show cumulative count of Article Views (full-text article views including HTML views, PDF and ePub downloads, according to the available data) and Abstracts Views on Vision4Press platform.
Data correspond to usage on the plateform after 2015. The current usage metrics is available 48-96 hours after online publication and is updated daily on week days.
Initial download of the metrics may take a while.