| Issue |
A&A
Volume 556, August 2013
|
|
|---|---|---|
| Article Number | A127 | |
| Number of page(s) | 10 | |
| Section | The Sun | |
| DOI | https://doi.org/10.1051/0004-6361/201220848 | |
| Published online | 08 August 2013 | |
Online material
Appendix A: Contribution of Hϵ to the Hinode broad-band Ca filter
The 0.3-nm-wide Hinode Ca prefilter was selected to record intensity images from wavelengths around the Ca ii H line core. However, close to the Ca ii H line core at 396.85 nm, one can also find one of the Balmer lines, namely Hϵ at about 397 nm. Hϵ is a chromospheric line like Hα, but shows only a small line depth on the disc (cf. the on-disc spectra in the second panel from the top in Fig. A.1). Here we investigate the amount that emission in Hϵ contributes to off-limb data taken with a broad-band Ca prefilter.
The Ca ii H spectra recorded with the PCO 4000 camera cover a wider spectral range than the default POLIS Ca CCD. In addition to the data set on disc center used above, we also have some spectra near and beyond the limb taken on 30 June 2010 available (top panel of Fig. A.1). The stray-light correction for these data was made by subtracting a fraction of an average off-limb profile (cf. Martínez González et al. 2012), with the necessary fraction being determined from the residual intensity in the blue line wing far away from the chromospheric lines. The Hinode broad-band Ca prefilter extends far enough into the Ca line wing to also cover the chromospheric Hϵ line at 397 nm (middle two panels of Fig. A.1). Beyond the limb, the Hϵ line goes into emission. The amplitude of the Hϵ emission exceeds that of Ca ii H in some height range above the limb (d ~ 0 to 3 Mm; third panel from the top in Fig. A.1).
We estimated the relative contribution of Ca ii H and Hϵ to the total synthetic filter intensity for a 0.3-nm-wide prefilter centred on the Ca ii H line core by calculating the fraction of intensity that comes from the wavelength ranges marked in the top panel of Fig. A.1 (396.721 to 396.939 nm and 396.939 to 397.156 nm for Ca ii H and Hϵ, respectively). The contribution of Hϵ slightly exceeds that of Ca ii H (bottom panel of Fig. A.1) close to the limb (d ~ 0 Mm; >50% contribution). However, the stray-light correction included a step function with zero correction on the disc and full correction beyond the – manually set – limb position, so the results close to the assumed limb position (| d | < 0.3 Mm) might depend to some extent on the stray-light correction and the chosen limb location. Profiles at d ~ 1 Mm should have a clean and uncritical stray-light correction and therefore should be fully reliable. These profiles still show a larger emission amplitude in Hϵ than in Ca ii H (third panel from the top in Fig. A.1). The emission amplitude of Hϵ decreases faster with increasing limb distance than that of Ca ii H, which exceeds the former for d > 3 Mm. The relative contribution of Hϵ to the Hinode broad-band Ca filter decreases from about 50% at the limb to about 20% at d = 5 Mm and remains at this value for higher heights. For the typical height range of spicules (0 to 5–6 Mm), the relative contribution of Hϵ is about 1/3 of the total filter intensity. This contribution is significant and should be taken into account in any future detailed modelling of the Hinode Ca imaging data such as done in
Judge & Carlsson (2010), where Hϵ was not yet included. The Hϵ line is located in the wing of the filter transmission curve where its slope is steep, which makes the amount of transmitted intensity also sensitive to the Doppler shifts of Hϵ and not only to the amplitude of its emission.
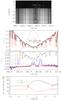 |
Fig. A.1
Relative contributions of Ca ii H and Hϵ to the intensity transmitted through the Hinode broad-band Ca filter. Top panel: average Ca ii H spectra near the limb. The vertical dotted and dashed lines denote the wavelength ranges attributed to Ca ii H and Hϵ, respectively. Second panel from the top: average observed on-disc (thick black line) and FTS spectrum (red line), and 0.3-nm-wide prefilter curve (dashed line, scaled arbitrarily). Third panel from the top: observed spectra at different limb distances. Bottom panel: relative contributions of Ca ii H (black line) and Hϵ (red line) to a 0.3-nm-wide prefilter. |
| Open with DEXTER | |
© ESO, 2013
Current usage metrics show cumulative count of Article Views (full-text article views including HTML views, PDF and ePub downloads, according to the available data) and Abstracts Views on Vision4Press platform.
Data correspond to usage on the plateform after 2015. The current usage metrics is available 48-96 hours after online publication and is updated daily on week days.
Initial download of the metrics may take a while.