Fig. A.1
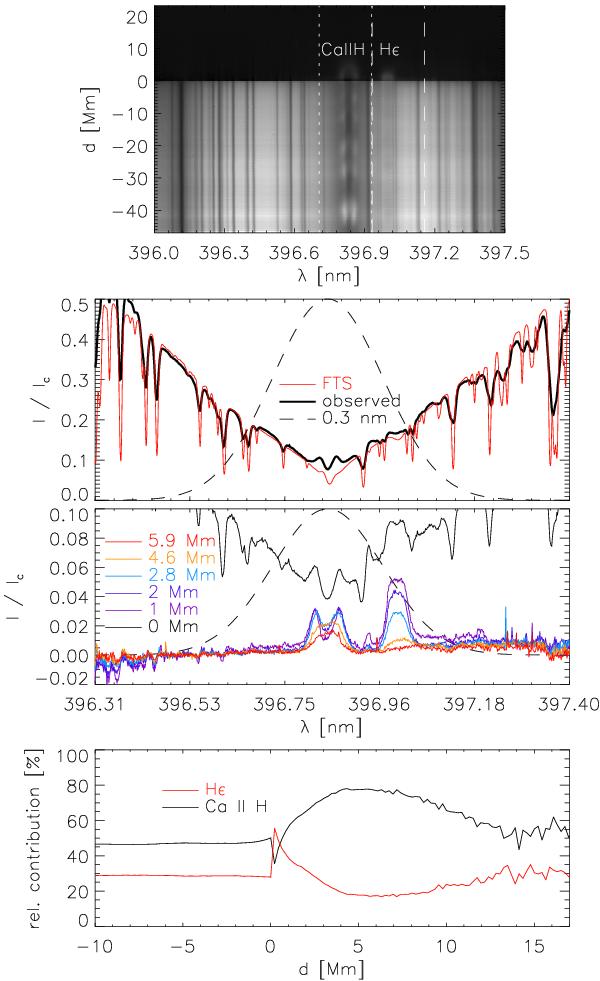
Relative contributions of Ca ii H and Hϵ to the intensity transmitted through the Hinode broad-band Ca filter. Top panel: average Ca ii H spectra near the limb. The vertical dotted and dashed lines denote the wavelength ranges attributed to Ca ii H and Hϵ, respectively. Second panel from the top: average observed on-disc (thick black line) and FTS spectrum (red line), and 0.3-nm-wide prefilter curve (dashed line, scaled arbitrarily). Third panel from the top: observed spectra at different limb distances. Bottom panel: relative contributions of Ca ii H (black line) and Hϵ (red line) to a 0.3-nm-wide prefilter.
Current usage metrics show cumulative count of Article Views (full-text article views including HTML views, PDF and ePub downloads, according to the available data) and Abstracts Views on Vision4Press platform.
Data correspond to usage on the plateform after 2015. The current usage metrics is available 48-96 hours after online publication and is updated daily on week days.
Initial download of the metrics may take a while.