| Issue |
A&A
Volume 554, June 2013
|
|
|---|---|---|
| Article Number | L3 | |
| Number of page(s) | 8 | |
| Section | Letters | |
| DOI | https://doi.org/10.1051/0004-6361/201321478 | |
| Published online | 04 June 2013 | |
Online material
Appendix A: Sample selection and SED fitting
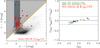 |
Fig. A.1
Left: location of the LBGs of Steidel et al. (2003) with confirmed spectroscopic redshifts (red dots) in the color–color diagram employed to select the LBGs studied in this work. The light grey shaded zone represents our selection window for LBGs at z ~ 3 (see Eq. (A.1)). Black open squares are the complete sample of galaxies in the Capak et al. (2004) photometric catalog. For comparison, we also show the selection window for LBGs of Pentericci et al. (2010) with a dark grey shaded zone. Right: photometric redshift accuracy for our LBGs at z ~ 3. Only galaxies with confirmed spectroscopic redshift via emission lines (light green symbols) or absorption lines (dark green symbols) in Steidel et al. (2003) are included. The PACS-detected LBG spectroscopically confirmed to be at z = 2.929 in Steidel et al. (2003) is indicated with an orange dot. The PACS-detected LBG spectroscopically confirmed to be at z = 2.975 in Popesso et al. (2009) and Balestra et al. (2010) is presented with a red dot. |
| Open with DEXTER | |
Our LBGs were selected through the classical dropout technique with the U, V, and I filters. By convolving the transmission curves of those filters with a large set of Bruzual & Charlot (2003, hereafter BC03) templates associated to different physical properties and redshifts (0 ≤ z ≤ 6) (see e.g., Oteo et al. 2013), we derive the analytical selection criterion  (A.1)The multi-wavelength photometric information from the optical to mid-infrared is taken from Santini et al. (2009), Capak et al. (2004), and Wang et al. (2010). We focus our work on the GOODS-North and GOODS-South fields since these are the two fields covered with the GOODS-Herschel FIR observations. The criterion shown in Eq. (A.1) is less restrictive than others employed in previous studies to look for LBGs at z ~ 3 (Grazian et al. 2007; Pentericci et al. 2010). As can be seen in the left panel of Fig. A.1, our selection window covers a wider area in the color–color diagram than that represented by the Pentericci et al. (2010) criterion. We also show in the left panel of Fig. A.1 the location of the spectroscopically confirmed LBGs at z ~ 3 of Steidel et al. (2003) in the GOODS-North field. To do that we have used the same photometric information as that employed to look for our LBGs, i.e., the photometric catalog of Capak et al. (2004). Most of the spectroscopically confirmed LBGs at z ~ 3 of Steidel et al. (2003) are within our selection window and, therefore, we conclude that Eq. (A.1) truly segregates LBGs at z ~ 3. In order to clean the sample from lower-redshift interlopers, we only select those galaxies whose photometric redshifts (see next paragraph) are within 2.5 ≤ zphot ≤ 4. We discard AGNs by ruling out sources with X-ray emission. In total, we segregate 2652 and 2537 LBGs candidates in GOODS-North and GOODS-South, respectively.
Photometric redshifts, age, dust attenuation, and stellar mass of our LBGs are obtained simultaneously by fitting their U to IRAC-8 μm with a large set of BC03 templates associated to different physical properties of galaxies. LBGs at z ~ 3 are not detected in the UV and the MIPS-24 μm have a significant contribution of dust emission features which are not considered in the elaboration of the BC03 templates. For these reasons, these wavelengths are not employed in the SED fits. We built the BC03 templates by using the software GALAXEV. In this process we adopt a Salpeter (1955) initial mass function (IMF) distributing stars from 0.1 to 100 M⊙ and select a constant value for metallicity of Z = 0.2 Z⊙. We consider values of age from 1 Myr to 7 Gyr in steps of 10 Myr from 1 Myr to 1 Gyr and in steps of 100 Myr from 1 Gyr to 7 Gyr. Dust attenuation is included in the templates via the Calzetti et al. (2000) law and parametrized through the color excess in the stellar continuum, Es(B − V). We select values for Es(B − V) ranging from 0 to 0.7 in steps of 0.05. We include intergalactic medium absorption adopting the Madau (1995) prescription. Regarding SFR, we adopt time-constant models. In this case, different values of the SFR do not change the shape of the templates, and the SFR can be obtained by using the Kennicutt (1998) calibration  (A.2)where L1500 is the rest-frame UV luminosity in 1500 Å. The L1500 is obtained for each galaxy by convolving its best-fit template with a top-hat filter centered in rest-frame 1500 Å. It should be noted that, throughout the work, we distinguish between LUV defined in a νLν way and L1500 considered in Lν units. The SFR derived from Eq. (A.2) is uncorrected for the attenuation that dust produces in the SED of galaxies. To obtain an estimation of the dust-corrected total SFR we have to introduce into Eq. (A.2) the dust-corrected L1500. It is obtained from L1500 by multiplying it by the dust correction factor 100.4A1500, where A1500 is the dust attenuation in 1500 Å. The values of A1500 are obtained from the SED-derived Es(B − V) assuming the Calzetti et al. (2000) law. Throughout the work, the total SFR calculated in this way will be called SED-derived total SFR, in contraposition with the more accurate UV+IR-derived total SFR obtained with the direct emissions in the UV and FIR (see later in the text). Once both age and dust-corrected total SFR are known for each source, and according to the assumed time-independent SFH, the stellar mass can be obtained from the product of both quantities.
We define the amplitude of the Balmer 4000 Å break as the ratio between the rest-frame 4500 and 3500 Å luminosities. These are also calculated by convolving each best-fit template with top-hat filters centered in 4500 and 3500 Å, respectively. The UV continuum slopes are calculated by fitting the UV continuum of each best-fit template with a power-law function (see for example Oteo et al. 2013; Finkelstein et al. 2012) between rest-frame 1300 and 3000 Å. We have not included the contribution of emission lines in the SED fits (Zackrisson et al. 2008; Schaerer & de Barros 2009, 2010; Schaerer et al. 2011, 2013; Atek et al. 2011; de Barros et al. 2012) since all our PACS-detected LBGs have m3.6 μm − m4.5 μm > 0 and, according to de Barros et al. (2012), the contribution of emission lines in their SED-derived parameters is not expected to be significant. The right panel of Fig. A.1 shows the accuracy of the photometric redshifts of our LBGs, that we define as σΔz = |zphot − zspec|/(1 + zspec) (see e.g., Oteo et al. 2013), is lower than 0.2 for all the sources. These values are comparable with those obtained at lower redshifts (Haberzettl et al. 2012) and are enough for our purposes.
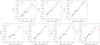 |
Fig. A.2
Rest-frame UV-to-FIR SEDs of the 7 PACS-detected LBGs at z ~ 3 in the GOODS-North fields. These plots represent the typical SED of the studied galaxies. Orange curves represent the best-fit Bruzual & Charlot (2003) templates to the U-band to IRAC-8 μm fluxes. Red curves represent the best-fit Chary & Elbaz (2001) templates to the MIPS-24 μm to PACS and SPIRE fluxes. The photometric redshift of each source is indicated in each panel. |
| Open with DEXTER | |
For all our PACS-detected LBGs we fit Chary & Elbaz (2001) templates to their IRAC-8 μm, MIPS-24 μm, PACS, and SPIRE fluxes (when available). As an example of the typical FIR SED-fitting results, we show in Fig. A.2 the rest-frame UV-to-FIR SEDs of the 7 PACS-detected LBGs at z ~ 3 in GOODS-North. We then obtain their total IR luminosities by integrating each best-fit template in the rest-frame interval [8–1000] μm. The dust attenuation of the PACS-detected LBGs is parametrized by the ratio between the total IR and rest-frame UV luminosities (see e.g., Buat et al. 2005). Their total SFR,
SFRtotal = SFRUV + SFRIR, are calculated by combining the total IR and rest-frame UV luminosities and applying the Kennicutt (1998) calibrations: SFRUV,uncorrected [M⊙ yr-1] = 1.4 × 10⁻²⁸ L1500 and SFRIR [M⊙ yr-1] = 4.5 × 10-44 LIR. It should be remarked that this procedure for obtaining the total SFR assumes that all the light absorbed by dust in the rest-frame UV is reemitted in turn in the FIR (see e.g., Magdis et al. 2010a).
For comparison, and with the aim of carrying out evolutionary studies, we compare the FIR-derived properties of our PACS-detected LBGs at z ~ 3 with a sample PACS-detected LBGs at z ~ 1 in the GOODS-North and GOODS-South fields. At that redshift, the Lyman break is located in the UV and LBGs must be selected by employing UV colors from space-based observations. For segregating our LBGs at z ~ 1 we adopt the selection criterion of Oteo et al. (2013). The photometric redshifts, stellar mass, age, and dust attenuation of the galaxies are obtained from a SED-fitting procedure with BC03 to their UV to NIR fluxes (Capak et al. 2007) in the same way as was done for LBGs at z ~ 3. Their FIR emission is also characterized with PACS data taken from the GOODS-Herschel project. The FIR-derived properties of the PACS-detected LBGs at z ~ 1, i.e., dust attenuation and UV+IR-derived total SFR are obtained in the same way as was done for the PACS-detected LBGs at z ~ 3. Because of the observational bias, LBGs at higher redshifts tend to be brighter. Therefore, if we want to compare galaxies at different redshifts which are selected through the same selection criterion, we must limit both samples to the same rest-frame UV luminosity. At z ~ 3, most LBGs have log LUV/L⊙ > 10. Imposing this limit, we end up with a sample of 31 PACS-detected LBGs at z ~ 1.
Properties of the PACS-detected LBGs at z ~ 3 studied in the present work.
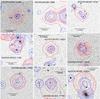 |
Fig. A.3
ACS optical cutouts (15′′ × 15′′) of the nine PACS-detected LBGs located in the GOODS-South field. In each image, the PACS-detected LBG is the source located in the center. Blue contours represent the emission in the bluest available IRAC image. Red contours trace the MIPS-24 μm emission. We use MIPS-24 μm instead of PACS countours because they are visually clearer and the PACS fluxes are extracted with MIPS-24 μm priors. |
| Open with DEXTER | |
© ESO, 2013
Current usage metrics show cumulative count of Article Views (full-text article views including HTML views, PDF and ePub downloads, according to the available data) and Abstracts Views on Vision4Press platform.
Data correspond to usage on the plateform after 2015. The current usage metrics is available 48-96 hours after online publication and is updated daily on week days.
Initial download of the metrics may take a while.