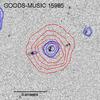
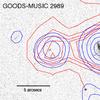
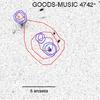
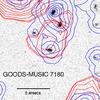
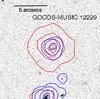
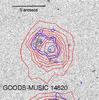
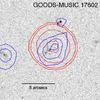
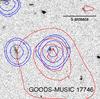
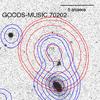
Fig. A.3
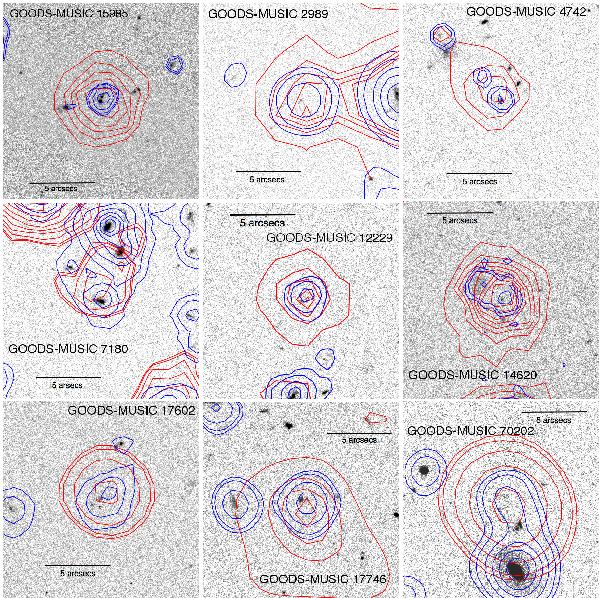
ACS optical cutouts (15′′ × 15′′) of the nine PACS-detected LBGs located in the GOODS-South field. In each image, the PACS-detected LBG is the source located in the center. Blue contours represent the emission in the bluest available IRAC image. Red contours trace the MIPS-24 μm emission. We use MIPS-24 μm instead of PACS countours because they are visually clearer and the PACS fluxes are extracted with MIPS-24 μm priors.
Current usage metrics show cumulative count of Article Views (full-text article views including HTML views, PDF and ePub downloads, according to the available data) and Abstracts Views on Vision4Press platform.
Data correspond to usage on the plateform after 2015. The current usage metrics is available 48-96 hours after online publication and is updated daily on week days.
Initial download of the metrics may take a while.